-
Introduction
-
Help Document
-
Browse
-
Features and Tools 2023
-
Search
-
Introduction
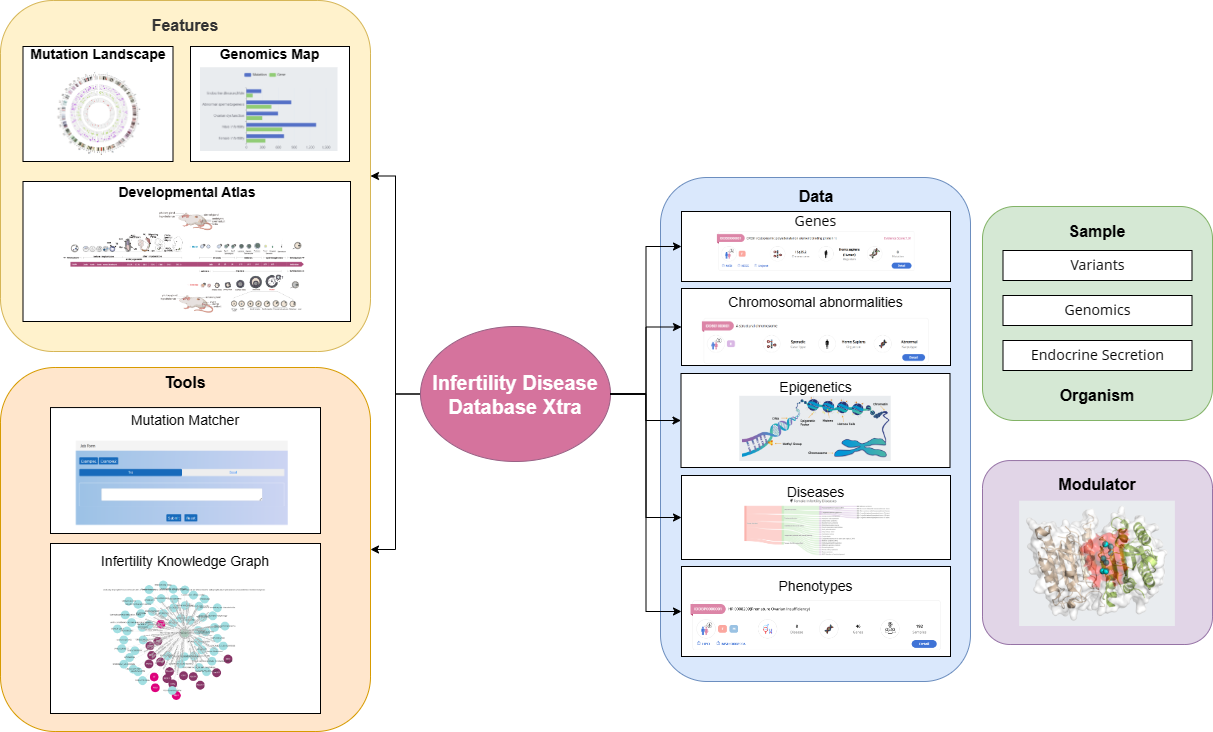
Infertility affects millions of people and their families and communities. It is estimated that 15% of couples experience infertility worldwide. To capture the significant development of infertility knowledge in recent 3 years after IDDB 1.0 was launched, we updated the IDDB (v2.0) with better high-confidence genetic records, multiple new types of data, practical bioinformatic tools and several new function modules, including infertility-associated genes, chromosomal region abnormalities, mutations, phenotypes, genomics datasets, and epigenetic datasets. Features in IDDB Xtra were manually curated as follows: 1) 647 human infertility phenotypes carefully curated from 2420 infertility patient samples in IDDB Xtra; 2) 60 multidimensional infertility genomics datasets fully screened from massive infertility studies, comprising 1429 infertility-related genes, 2766 mutations and 2021 patient samples; 3) a total of 464 infertility epigenetics data comprised miRNA, LncRNA, histone modification and DNA methylation; 4) Over 1,000 metabolites and modulators relevant to infertility diagnosis and treatment were manually curated from the literature, patents, and pathway knowledge bases; 5) Developmental-atlas module summarized all infertility-related genes separately based on different developmental stages and organs of human and mouse; 6) Mutation landscape and Mutation matcher module provided a view of curated infertility mutations distributed on the chromosome, and provided a bioinformatic tool to analyze clinical sequence data directly; 7) Infertility knowledge graph module supplied a systematic biomedical insight into infertility and a way to derive potential genetic factors by integrating diversity of biomedical data both within and without IDDB Xtra. 8) Endocrine secretion browse module provided an intuitive platform to retrieve potential genetic mechanism beneath clinical samples. To the best of our knowledge, IDDB Xtra is an updated heterogenous infertility database, which is more comprehensive on data scale, data category and data exploration tools, providing as a versatile resource for better exploring infertility.
-
Getting Started: IDDB Xtra
Below is the statistics of the database.

Website Organization
Top Menu: The top menu contains nine sub menus. By clicking each menu, user can browse each page quickly.

Quick Search: The search tool is in the middle of home page. It allows users to search the whole database by inputting a keyword.

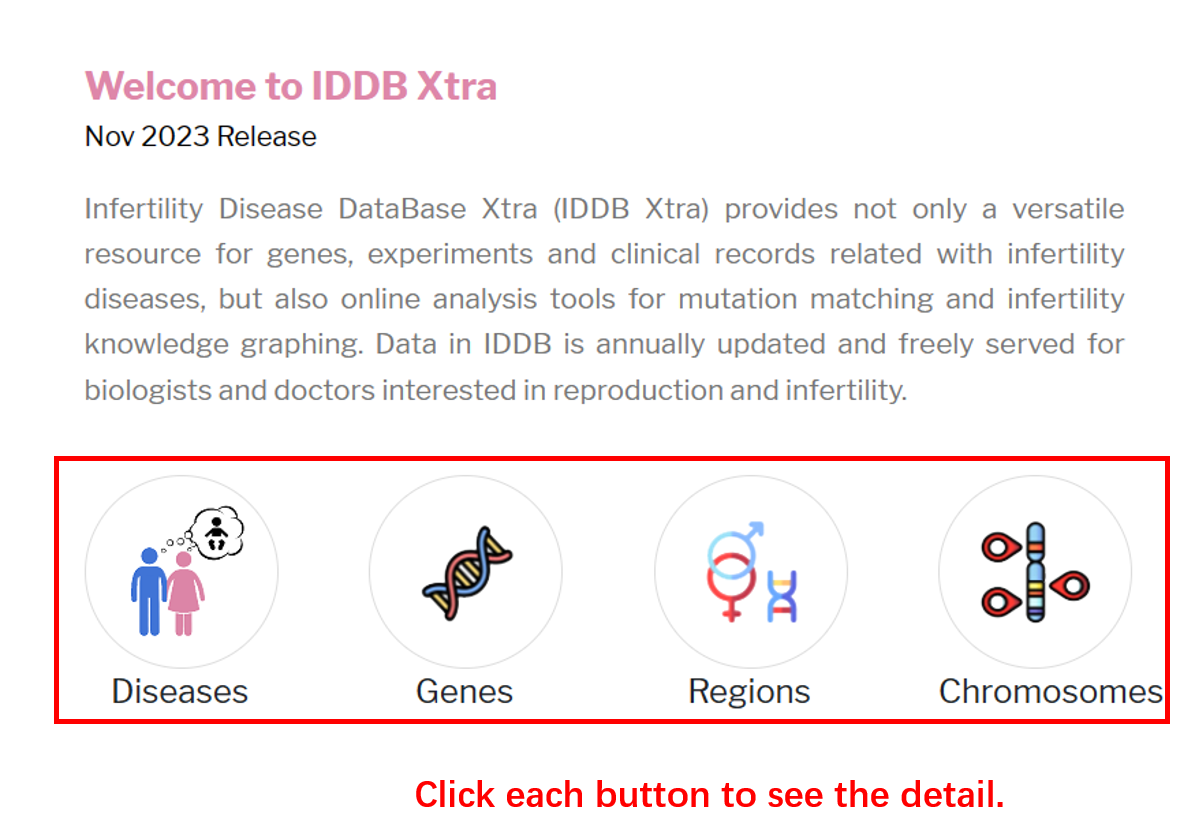
Quick Link: On the bottom of quick search, there are briefly descriptions and quick links to different section of IDDB. By clicking four buttons as follows, user can see the detail of each section including diseases, genes, chromosomal regions and chromosomal locations.
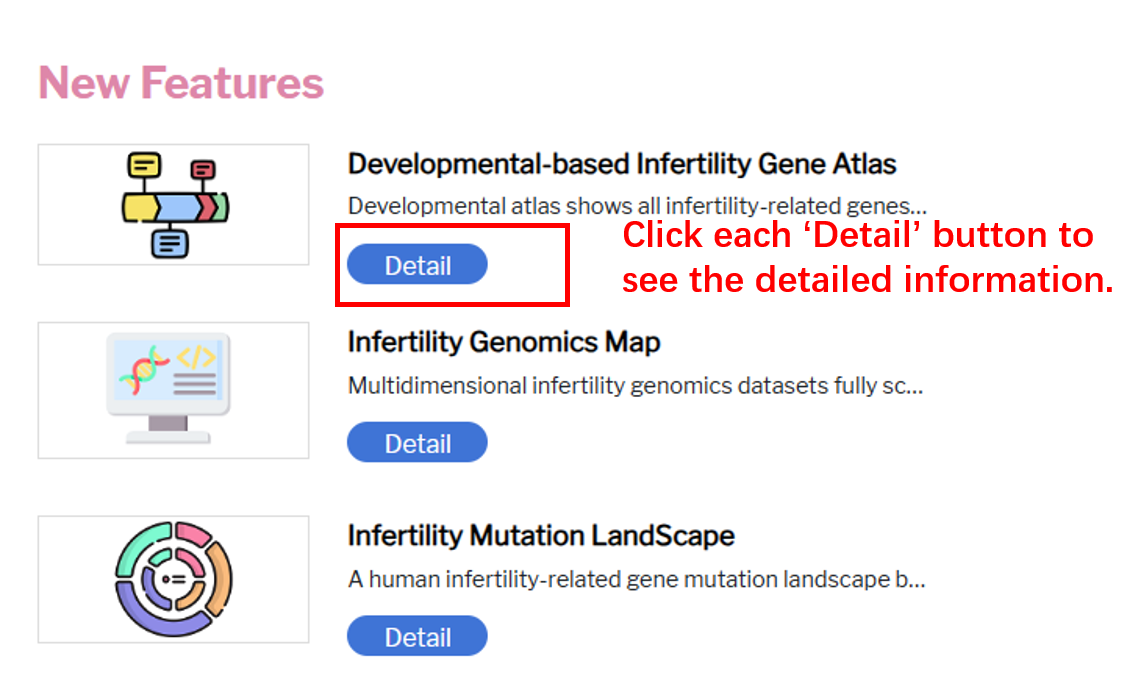
Quick Link: On the right of homepage, there are three new features updated in this version of database. By clicking “Detail” buttons, user can see the detail of each feature.
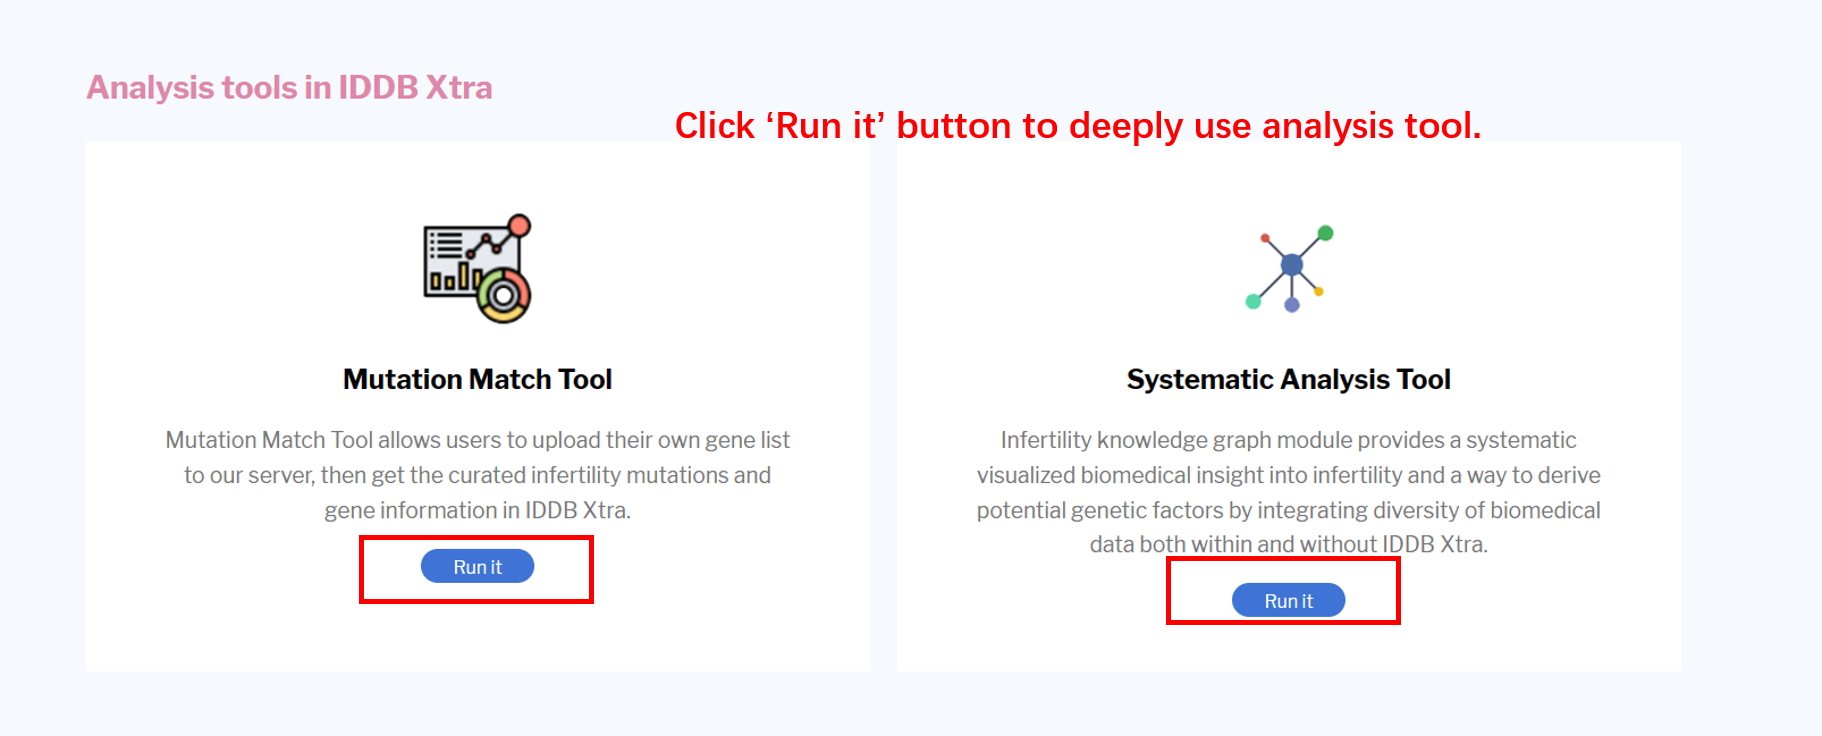
Quick Link: Two analysis tools were demonstrated in the middle of the homepage. By clicking “Run it” buttons, user can see the detail of each tool.
Data Organization
The functions and capabilities of the lDDB Xtra database is illustrated in the following image:
How to cite
Citing IDDB: If you find IDDB useful, please consider citing the reference that describes this work: IDDB: a comprehensive resource featuring genes, variants and characteristics associated with infertility. Nucleic Acids Res. 2021 Jan 8;49(D1):D1218-D1224. Journal: Nucleic Acids Research
Software Requirement
Mozilla Firefox, version 5 or above(Download);Chrome, version 9 or above(Download);
Safari, version 5 or above(Download);
Edge, version X or above(Download);
The latest version of Firefox and Chrome is recommended for visualization.
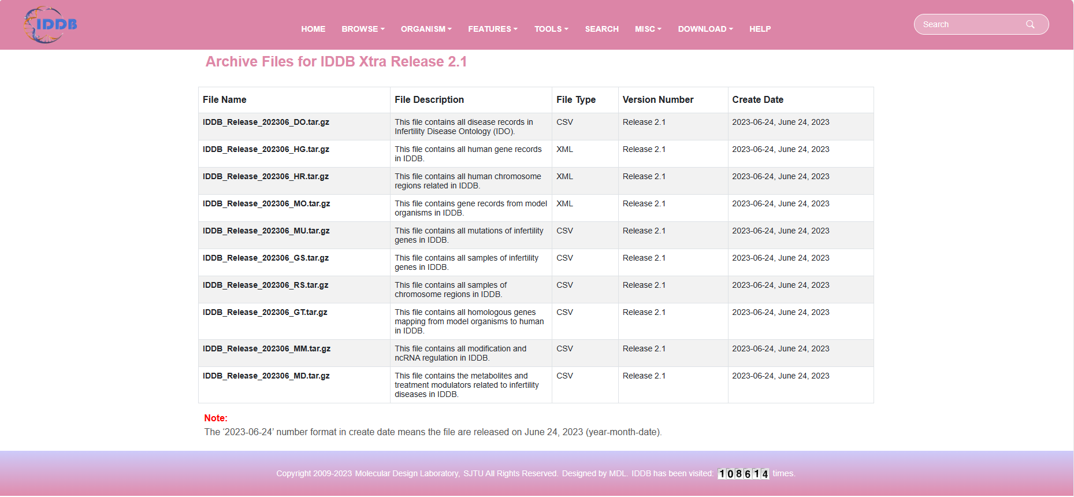
Download
By clicking “Download” on the navigation bar, user can see the download page. user can browse all genes of the selected organism in the database.
-
Browse
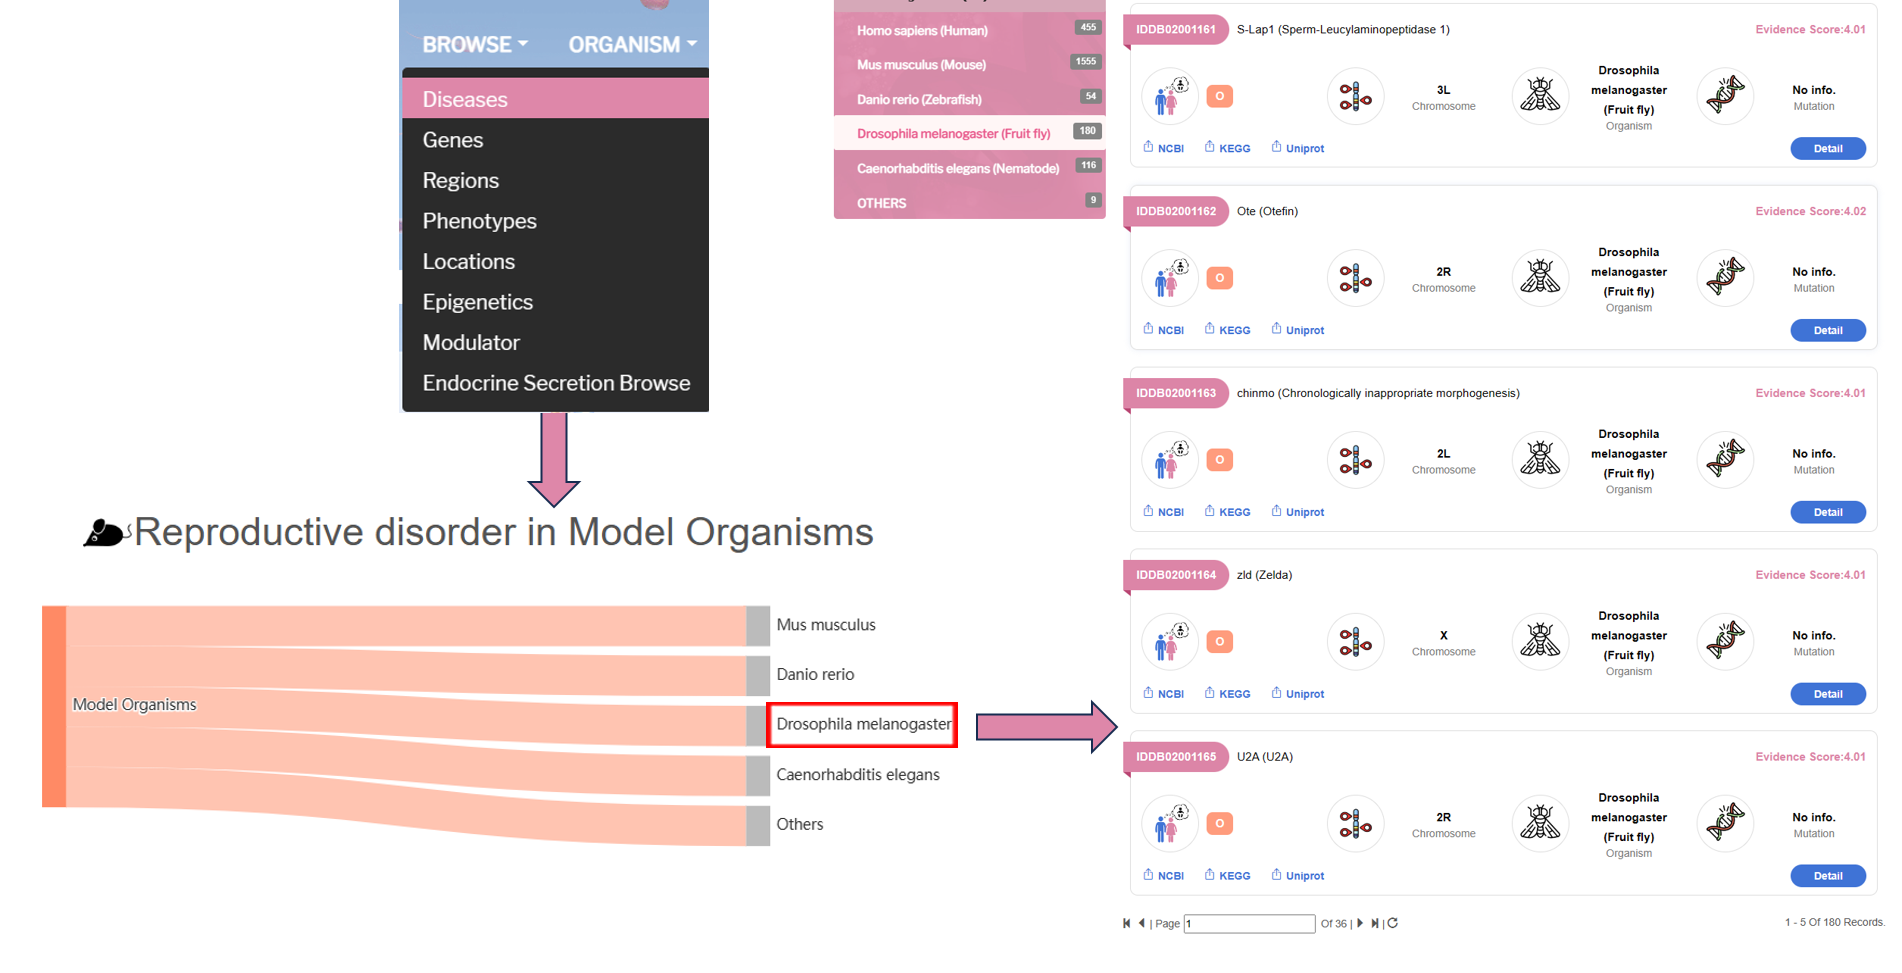
There are four parts of disease ontology page, which are Female Infertility Diseases, Male Infertility Diseases, Recurrent pregnancy loss / miscarriage and Model Organisms of Reproductive Disorders.
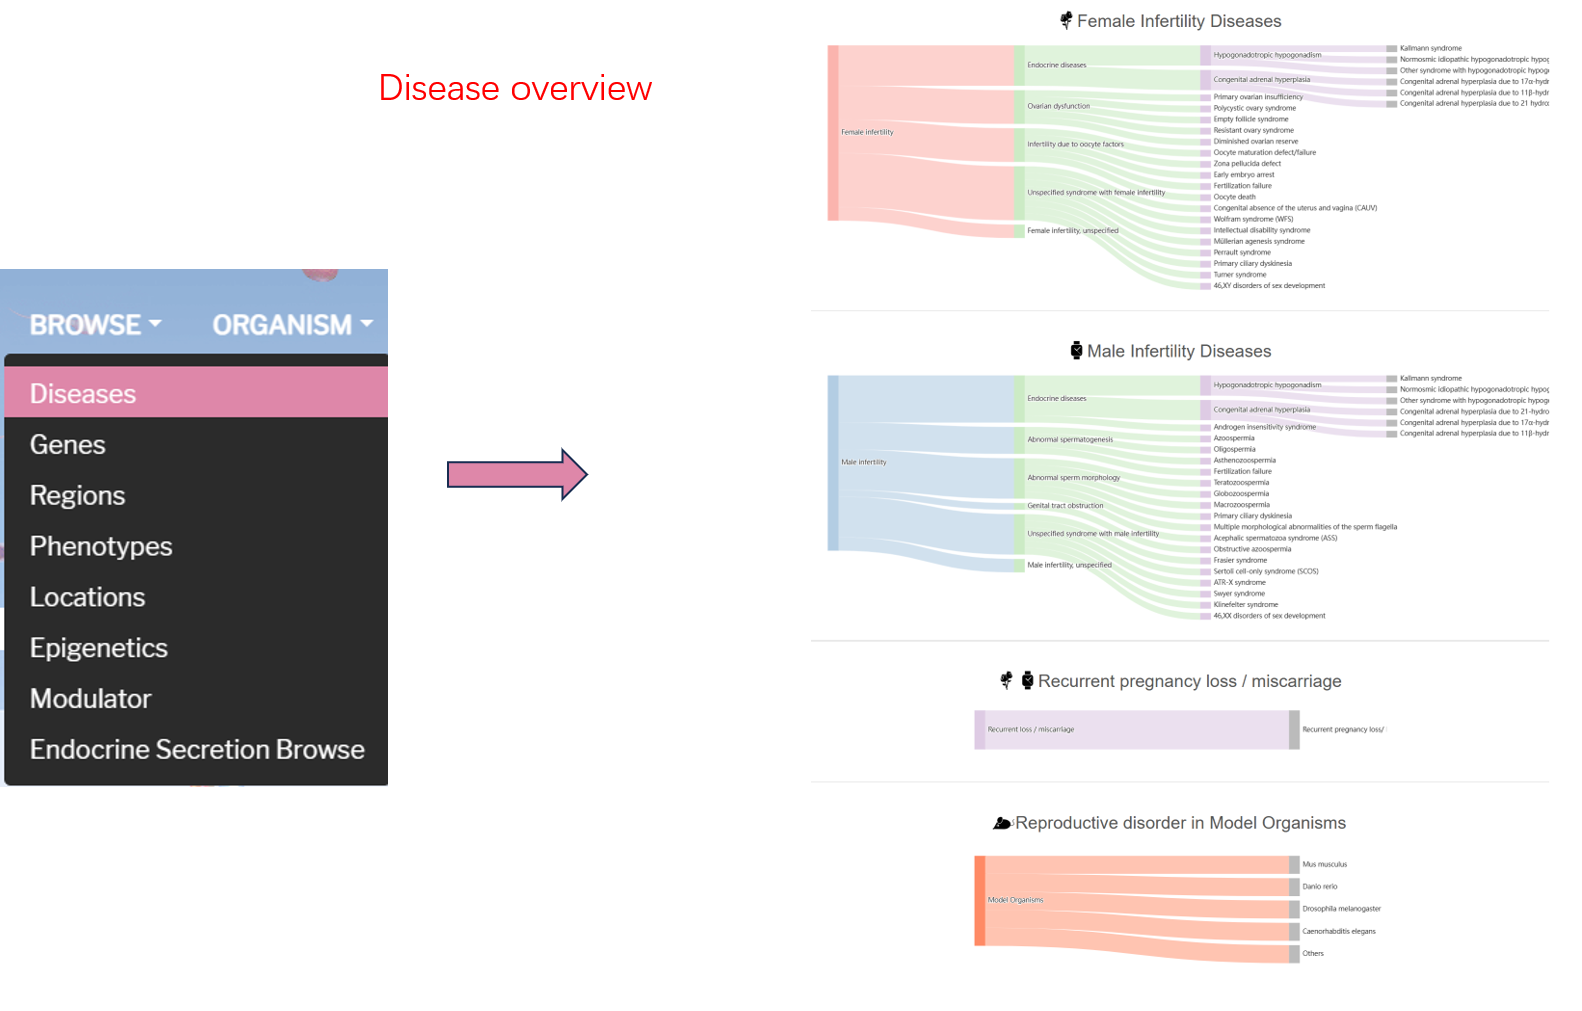
Female Infertility Diseases section lists all kinds of diseases of female infertility. User can see the detail of each disease by clicking the disease item. For male infertility disease, it's the same way to see gene detail.
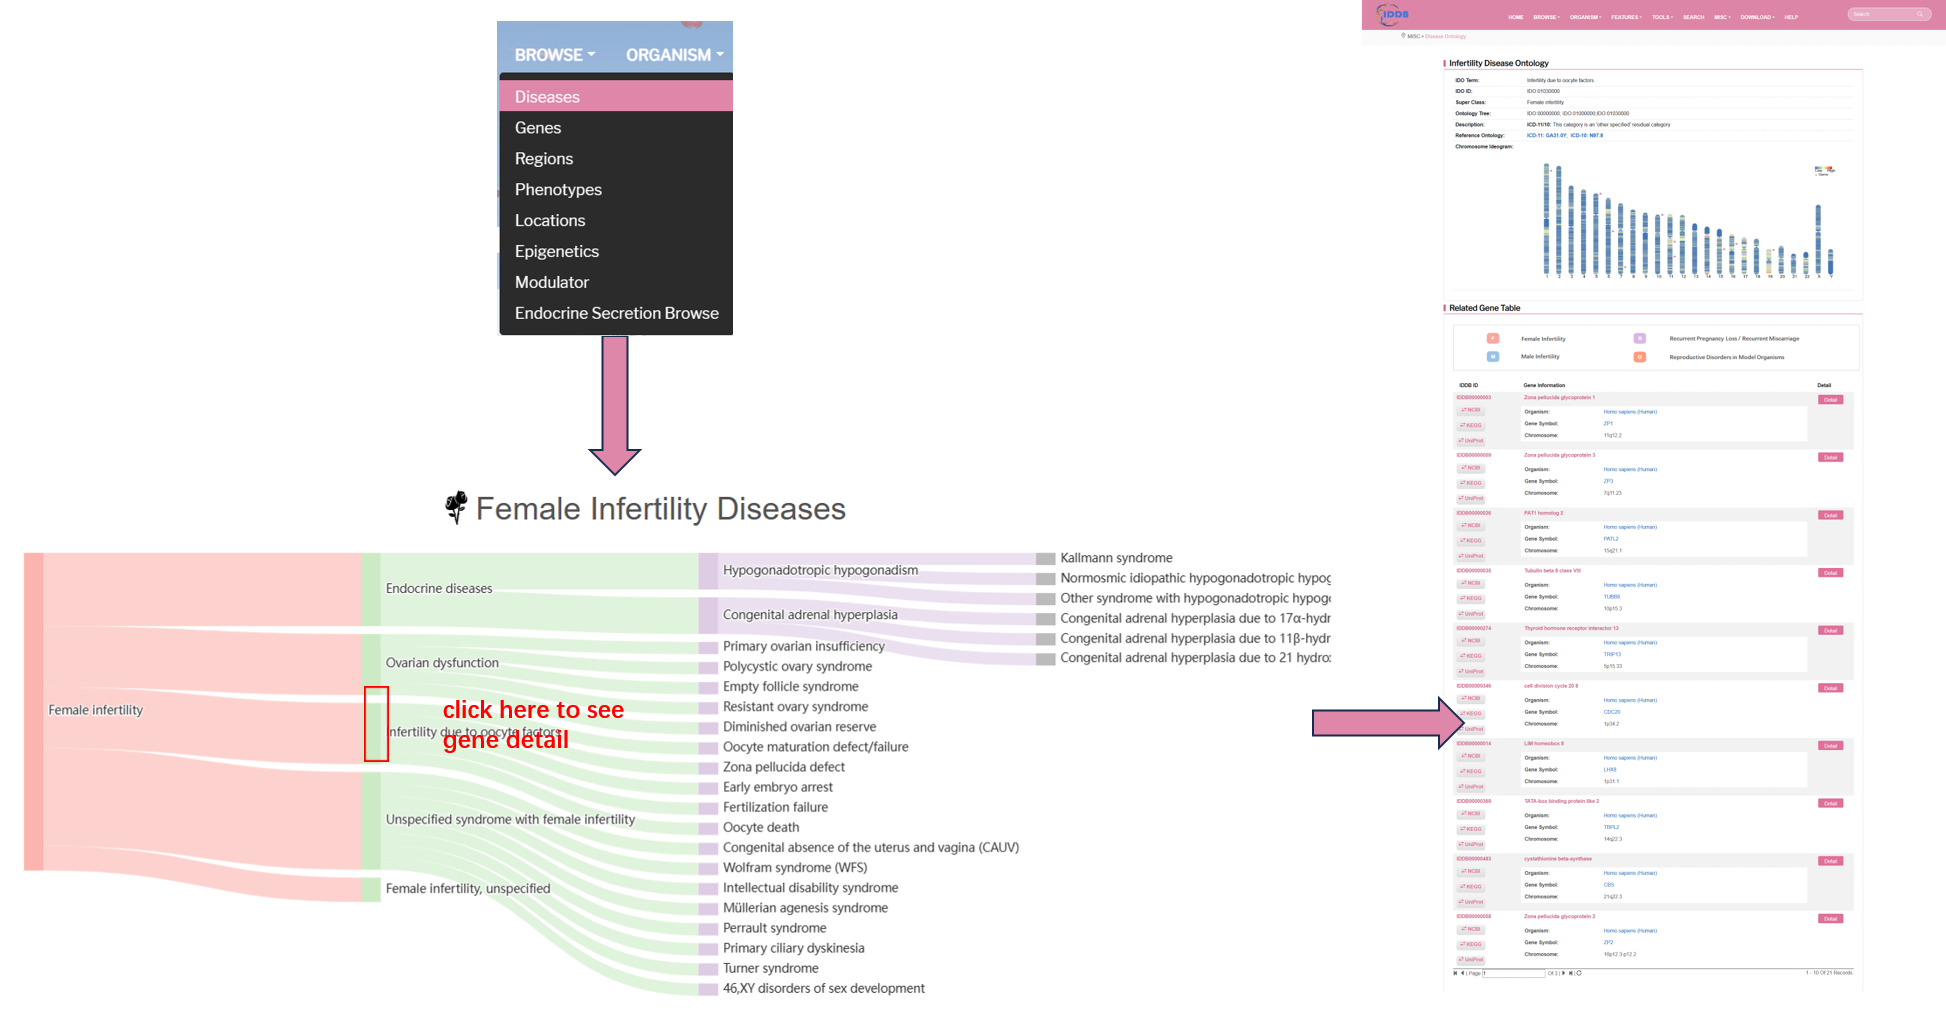
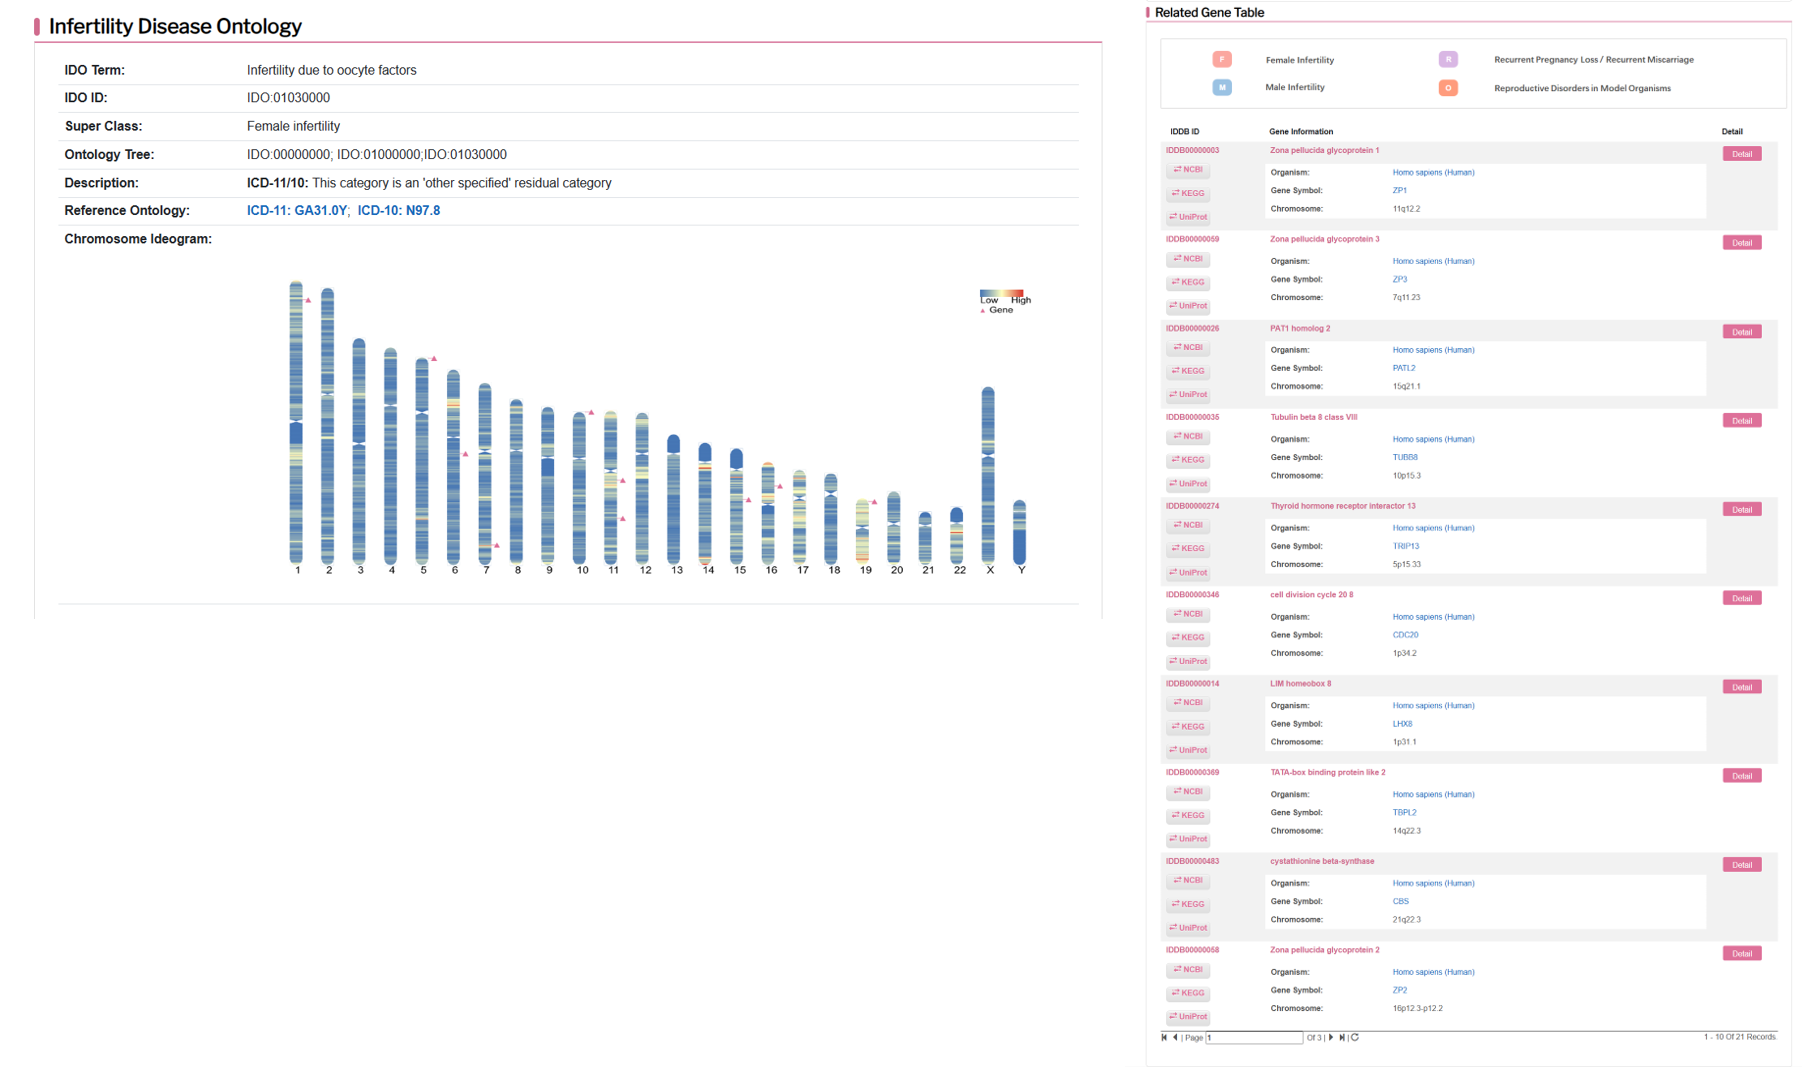
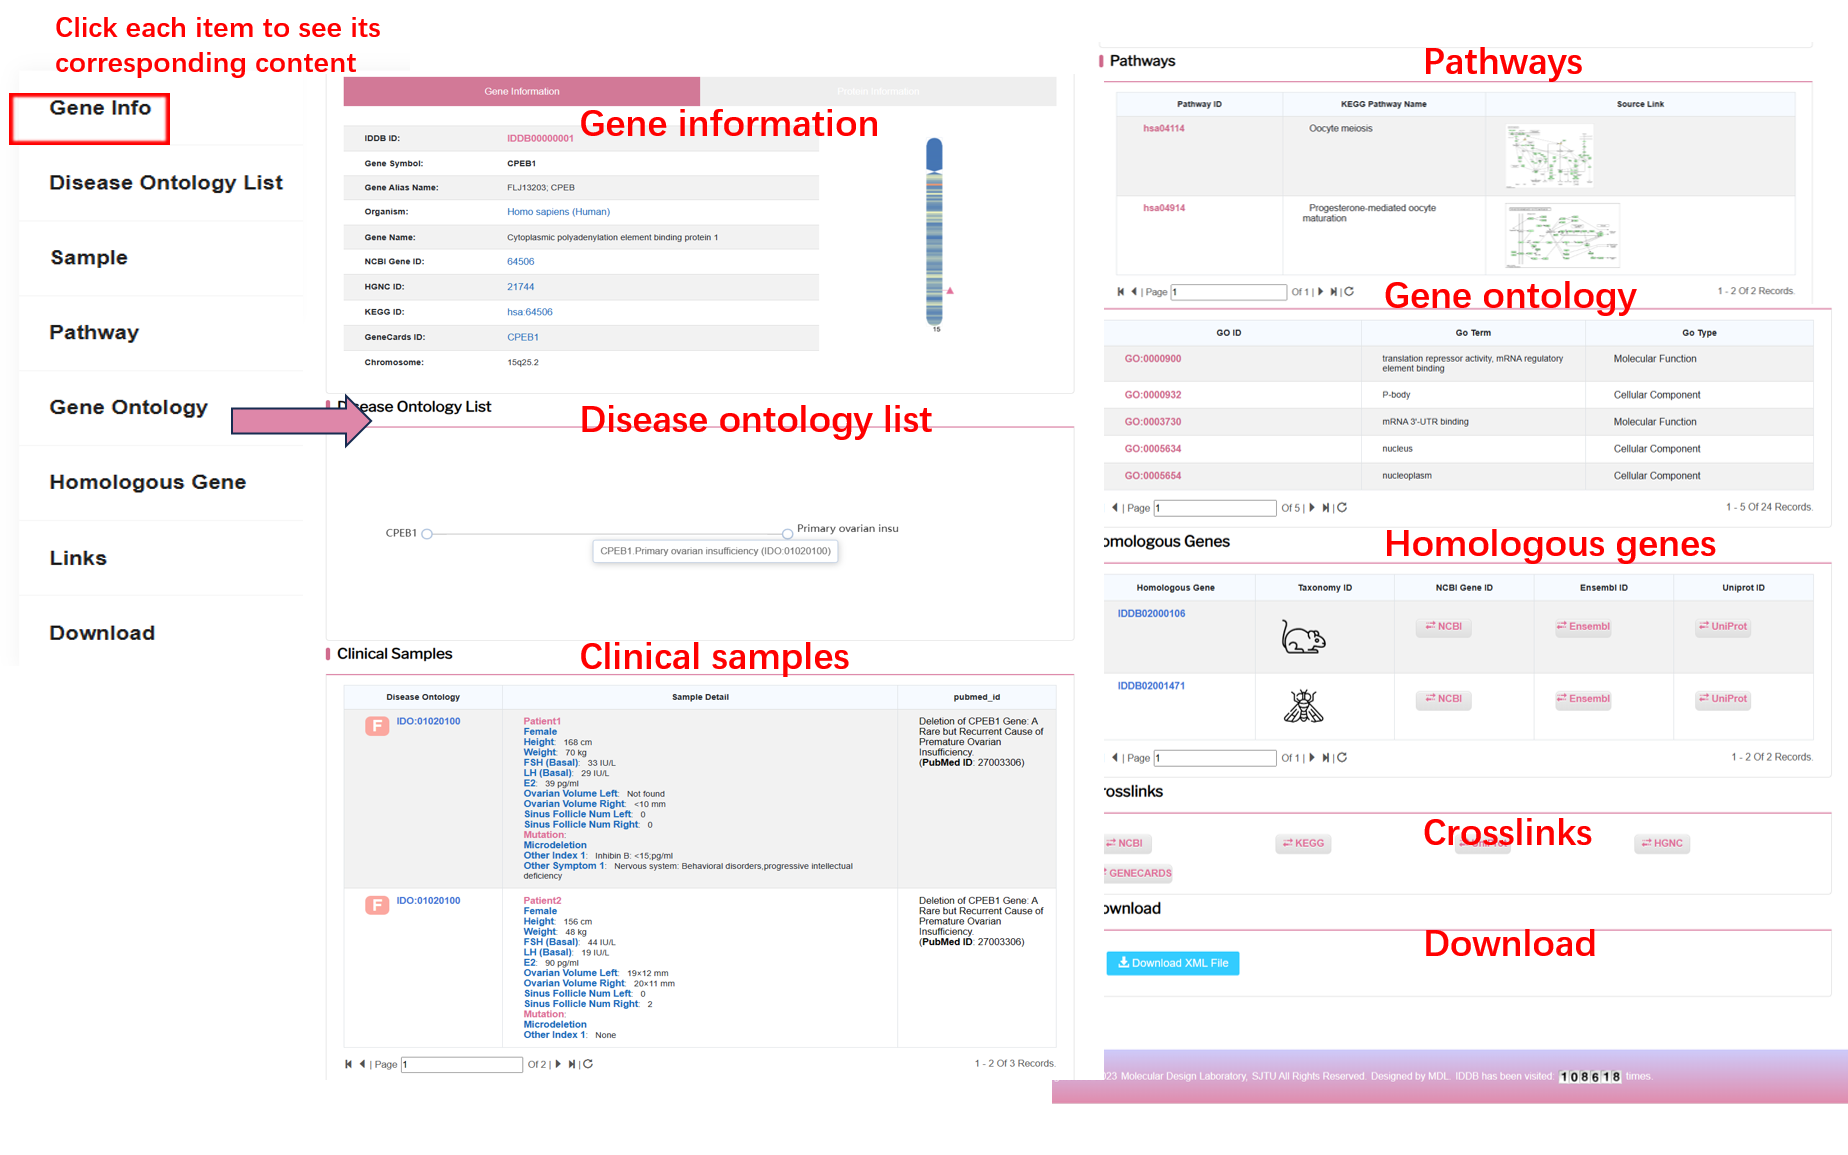
There are three parts in the gene detail page, which are infertility disease ontology, related gene table and related chromosome region table. Infertility disease ontologylists description of each disease, including disease name, disease definition, chromosome ideogram and so on.
By clicking the model organism, user can see the infertility disease genes of each organism.
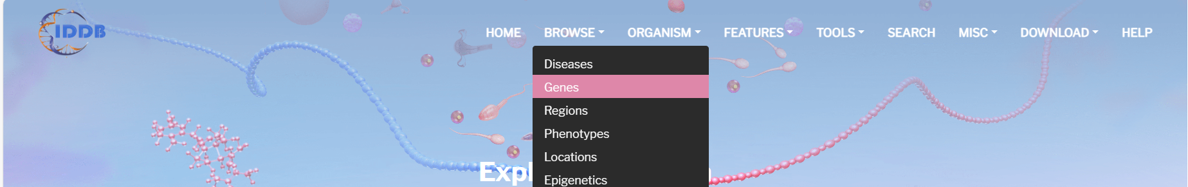
By clicking “GENES” on the navigation bar, user can browse all genes in the database.
On the left of this page, there is an infertility disease tree including 68 kinds of diseases and the counts of each disease. On the right of this page, there is a list of genes of all infertility diseases. User can browse genes of each disease by clicking the disease item.
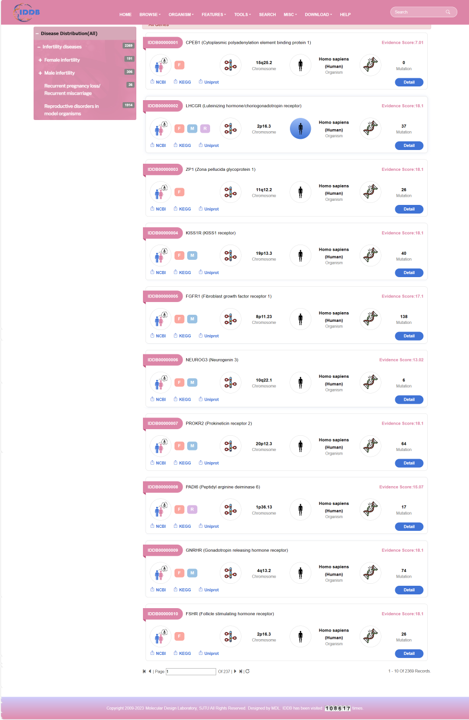
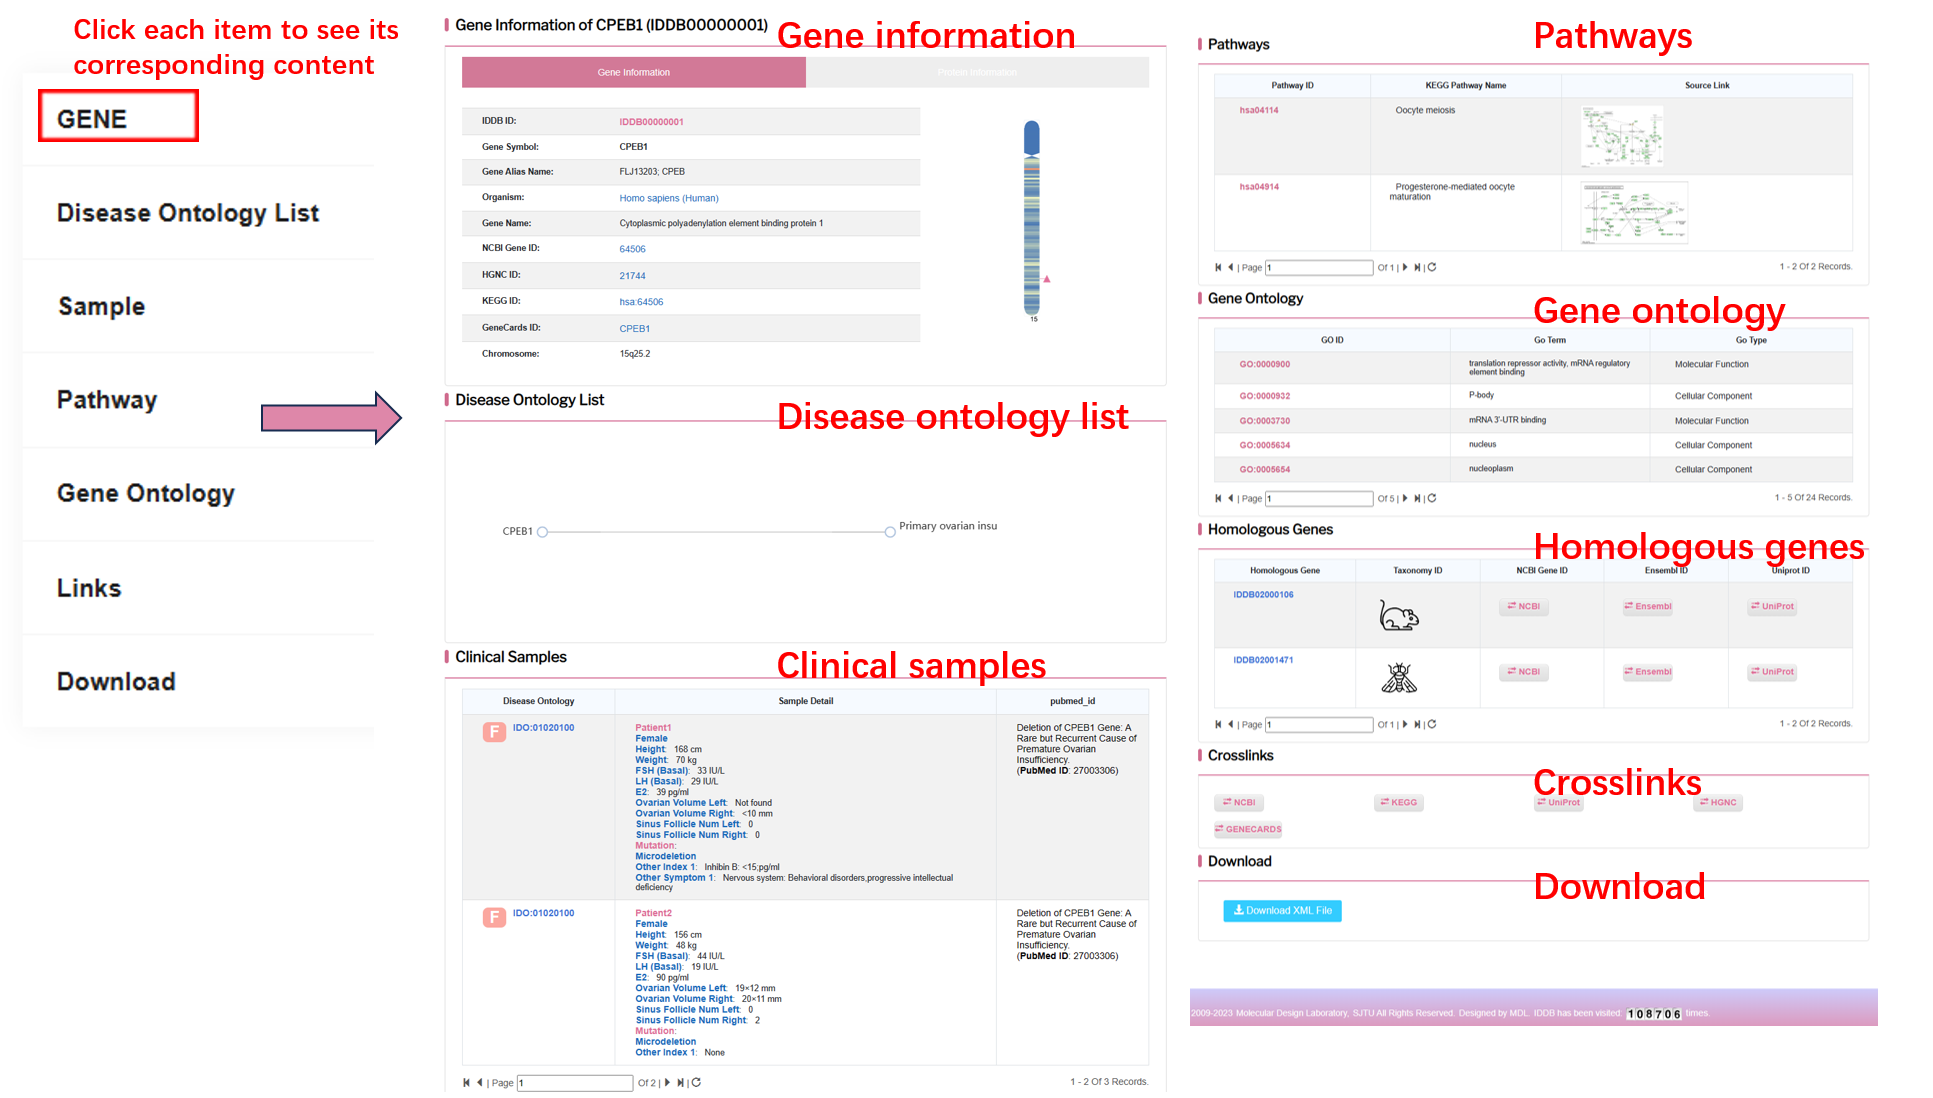
By clicking “Detail” button, user can see the detail of each gene.
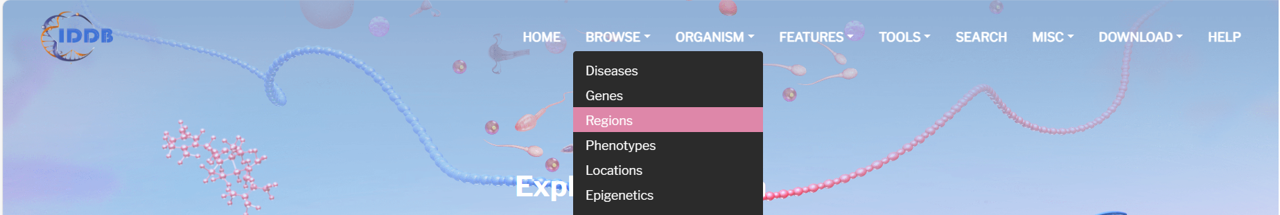
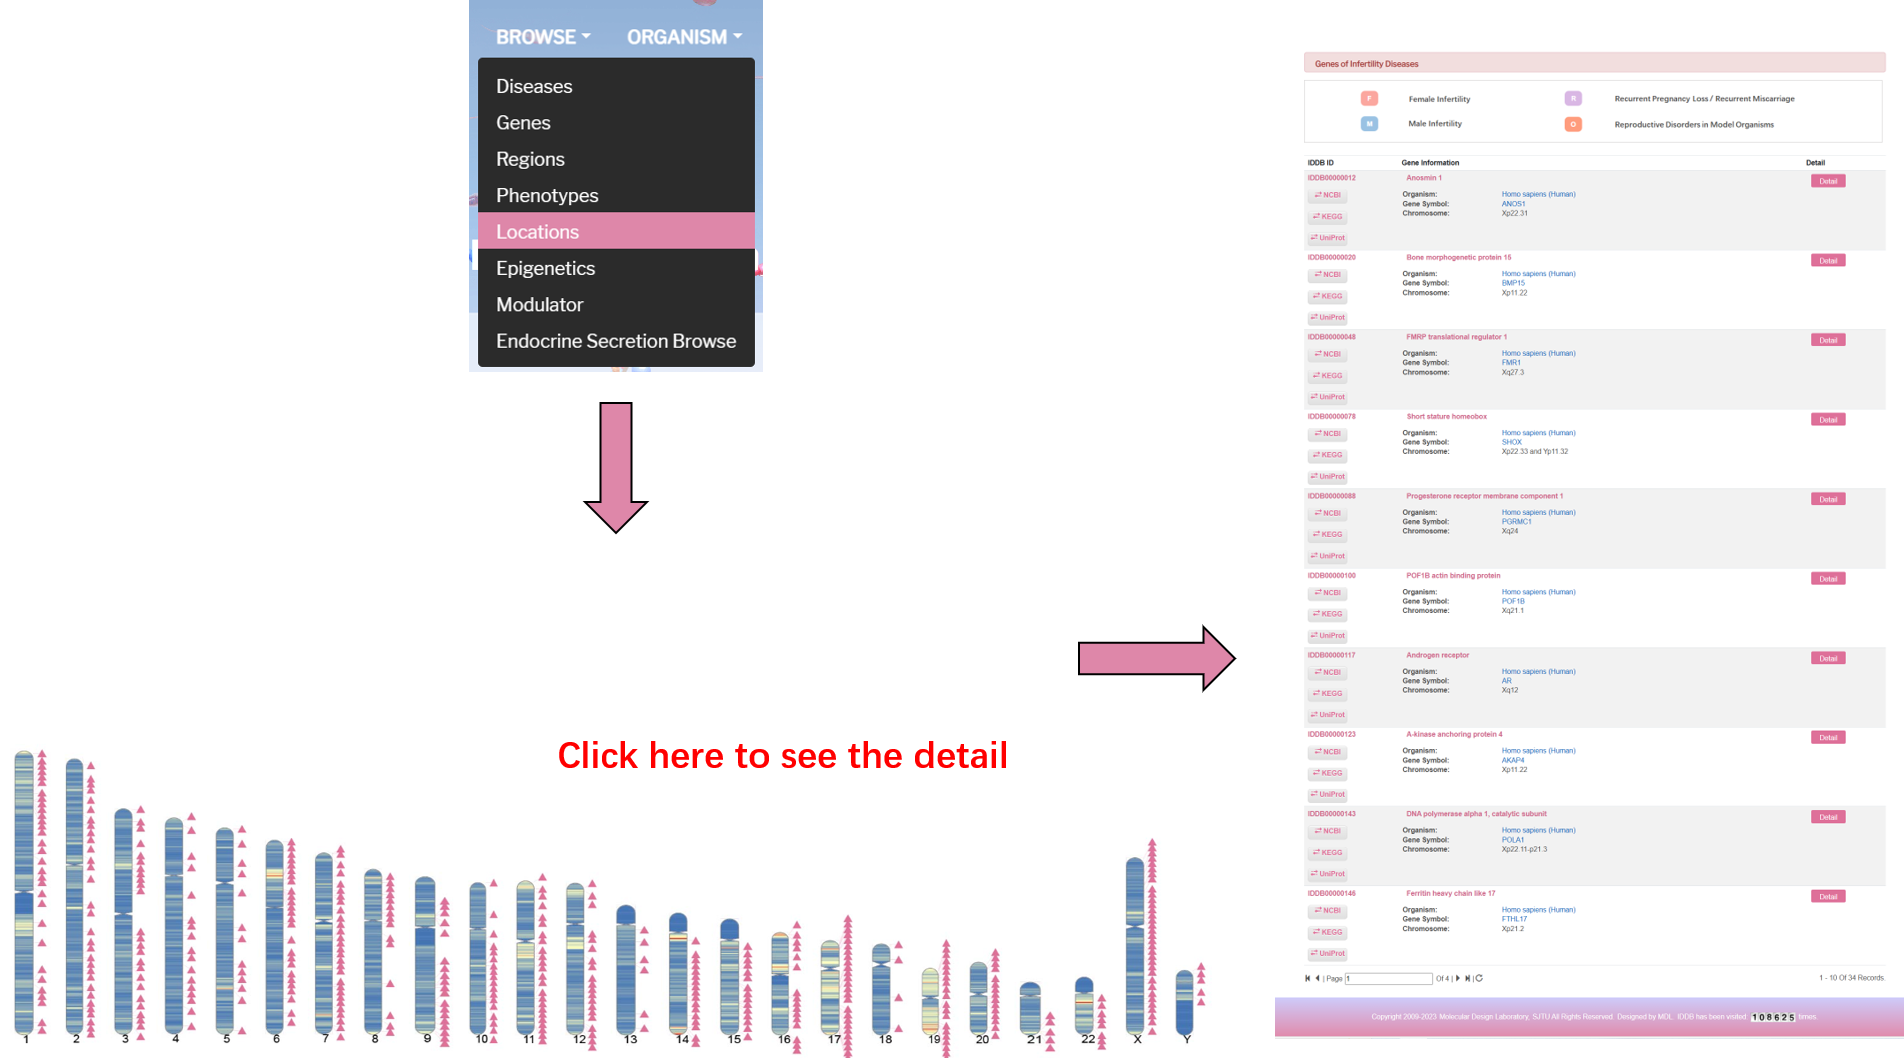
By clicking “REGIONS” on the navigation bar, user can browse all regions in the database.
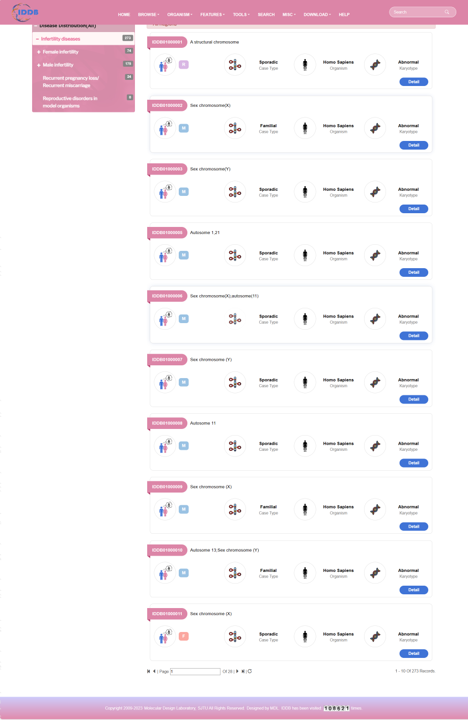
On the left of this page, there is an infertility disease tree including 68 kinds of infertility diseases and the counts of regions of each disease. On the right of this page, there is a list of regions of all infertility diseases. User can browse regions of each disease by clicking the disease item.
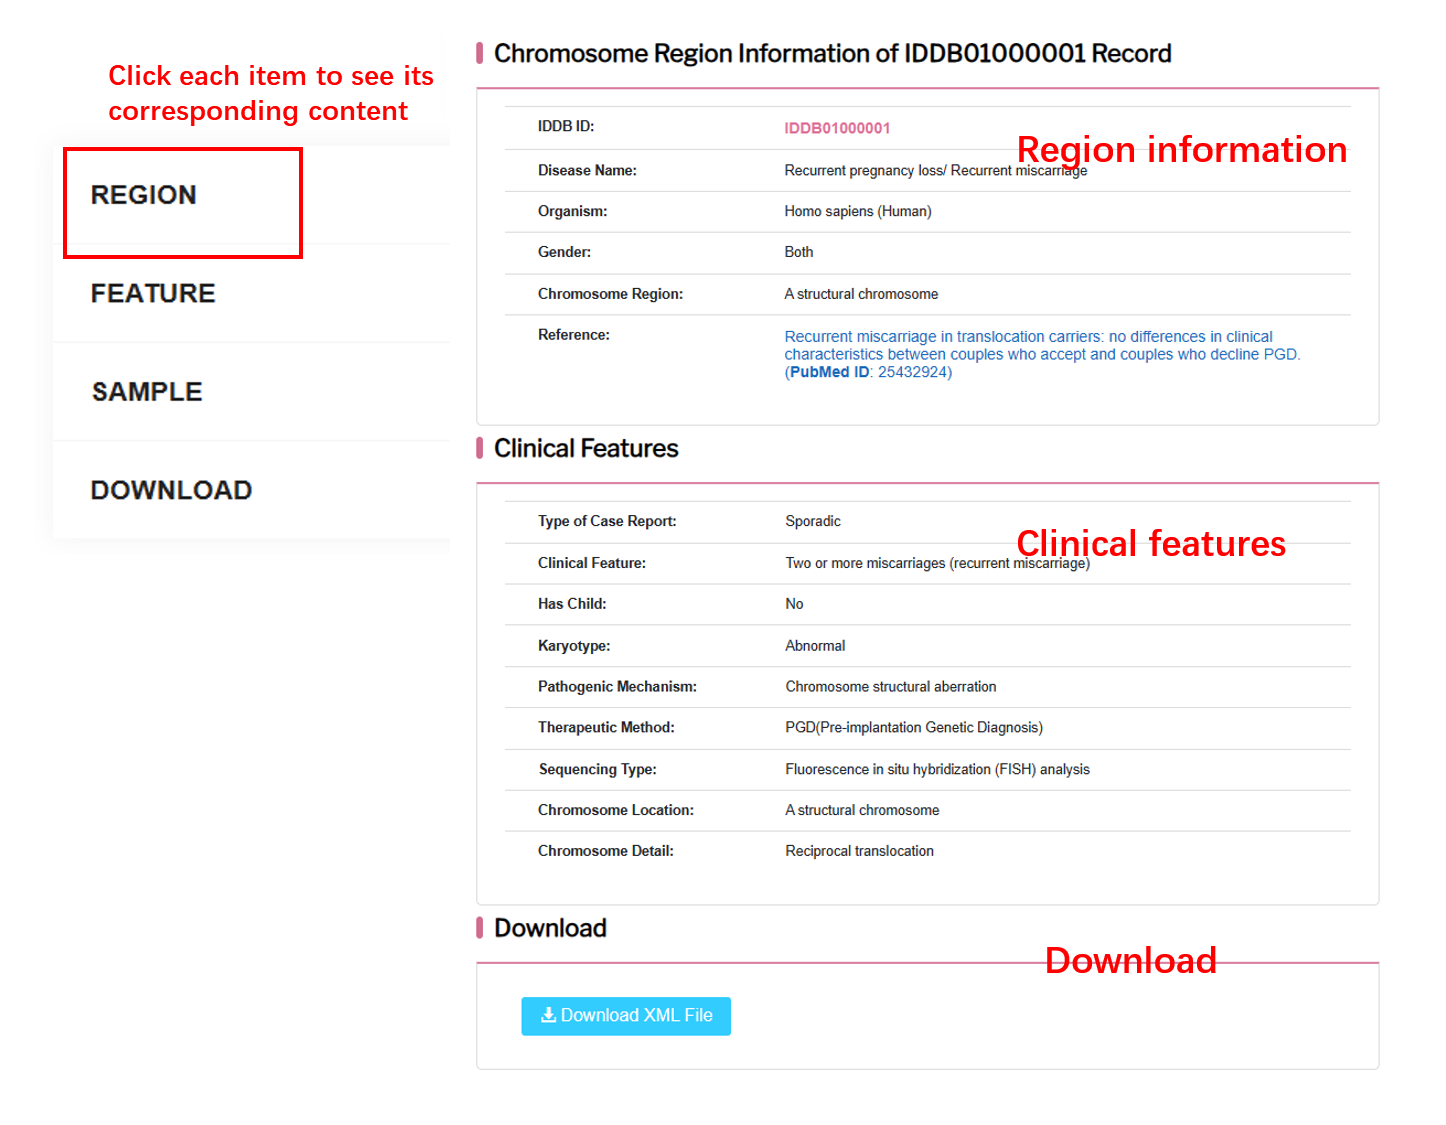
By clicking “Detail” button, user can see the detail of each region.
By clicking “Phenotype” on the navigation bar, user can browse all phenotypes in the database.
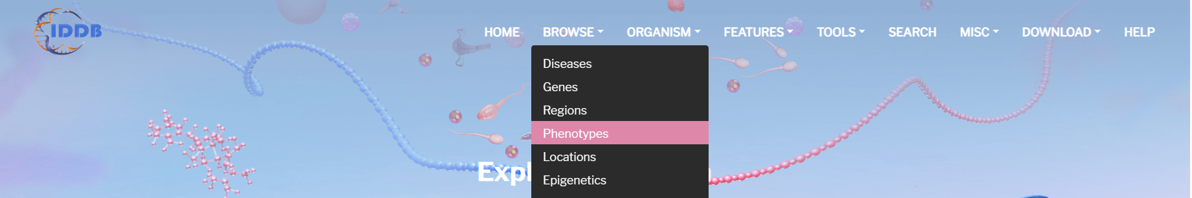
On the left of this page, there is an infertility disease tree including 68 kinds of infertility diseases and the counts of phenotypes of each disease. On the right of this page, there is a list of phenotypes of all infertility diseases. User can browse phenotypes of each disease by clicking the disease item.
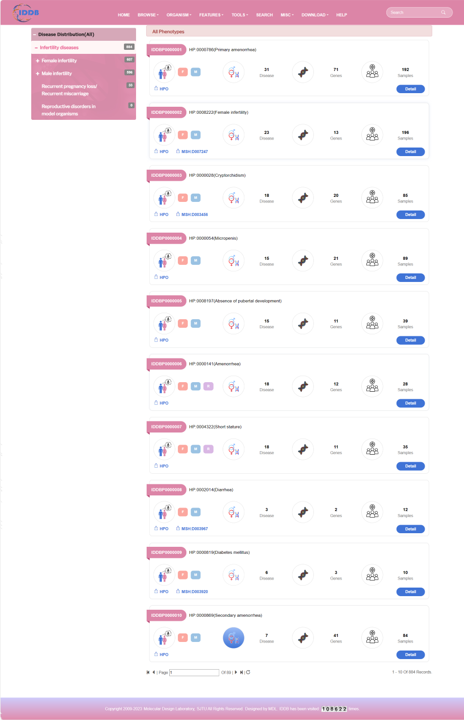
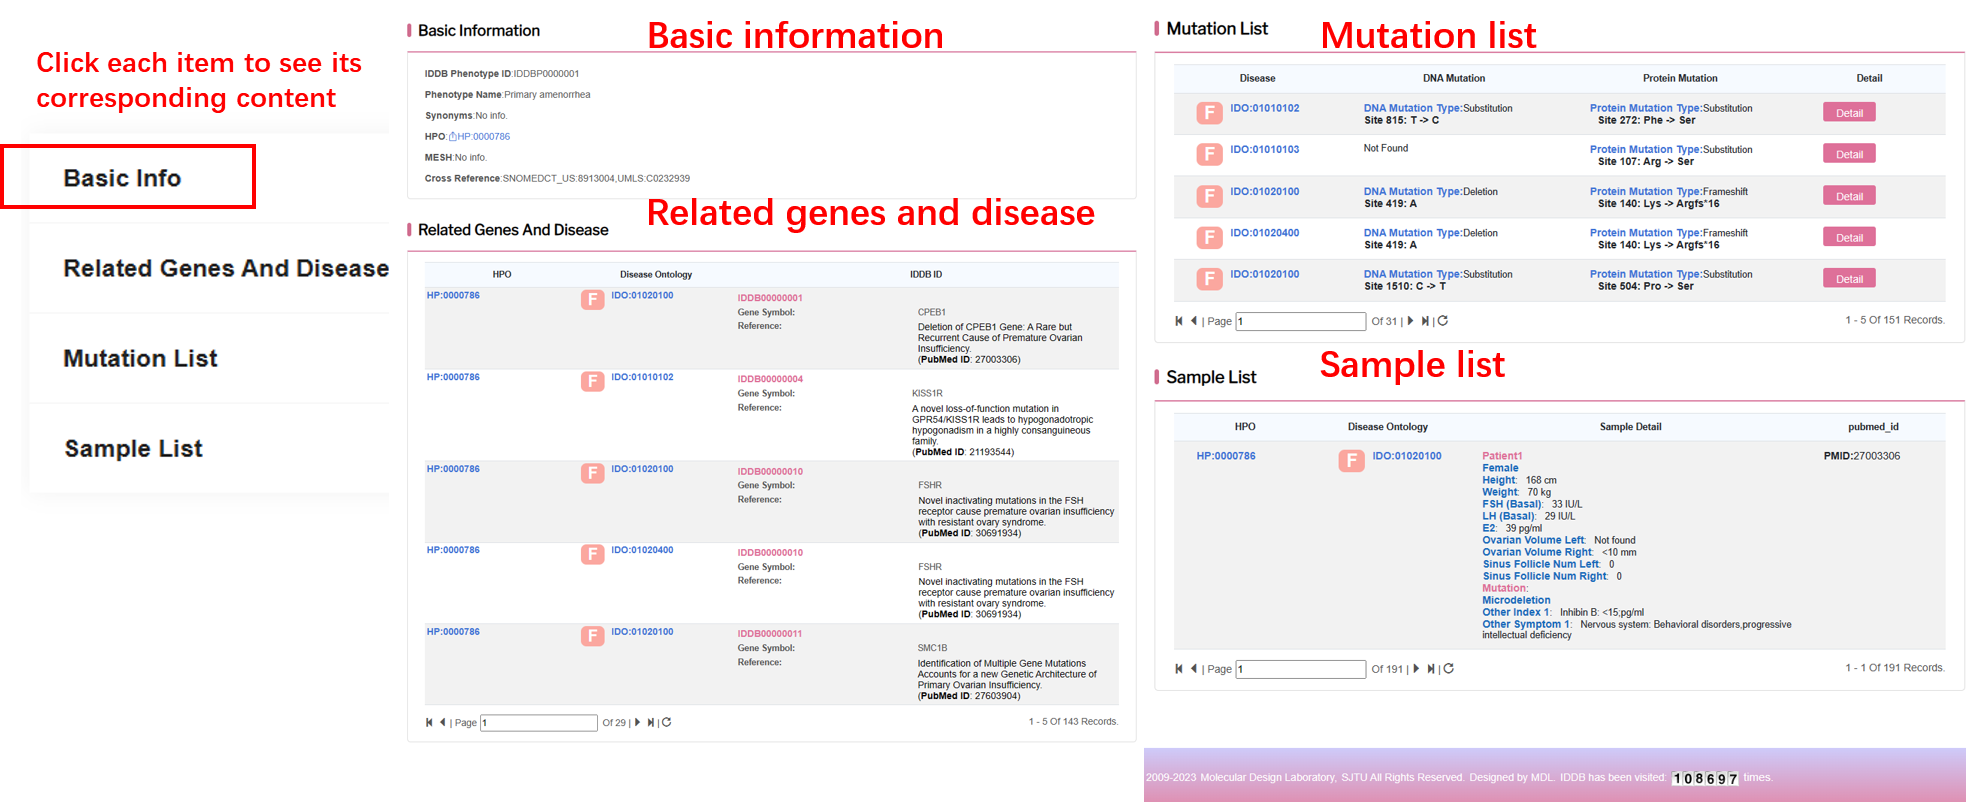
By clicking “Detail” button, user can see the detail of each phenotype.
All the information of chromosome cytoband for human infertility genes in IDDB were annotated, and marked in the ideogram of human chromosomes. The user can enter the Chromosome Browser, and click the interested chromosome to view the gene list. For each chromosome, the cytoband color means frequency of genes in the region, and each infertility gene is present as a pink trangle node.
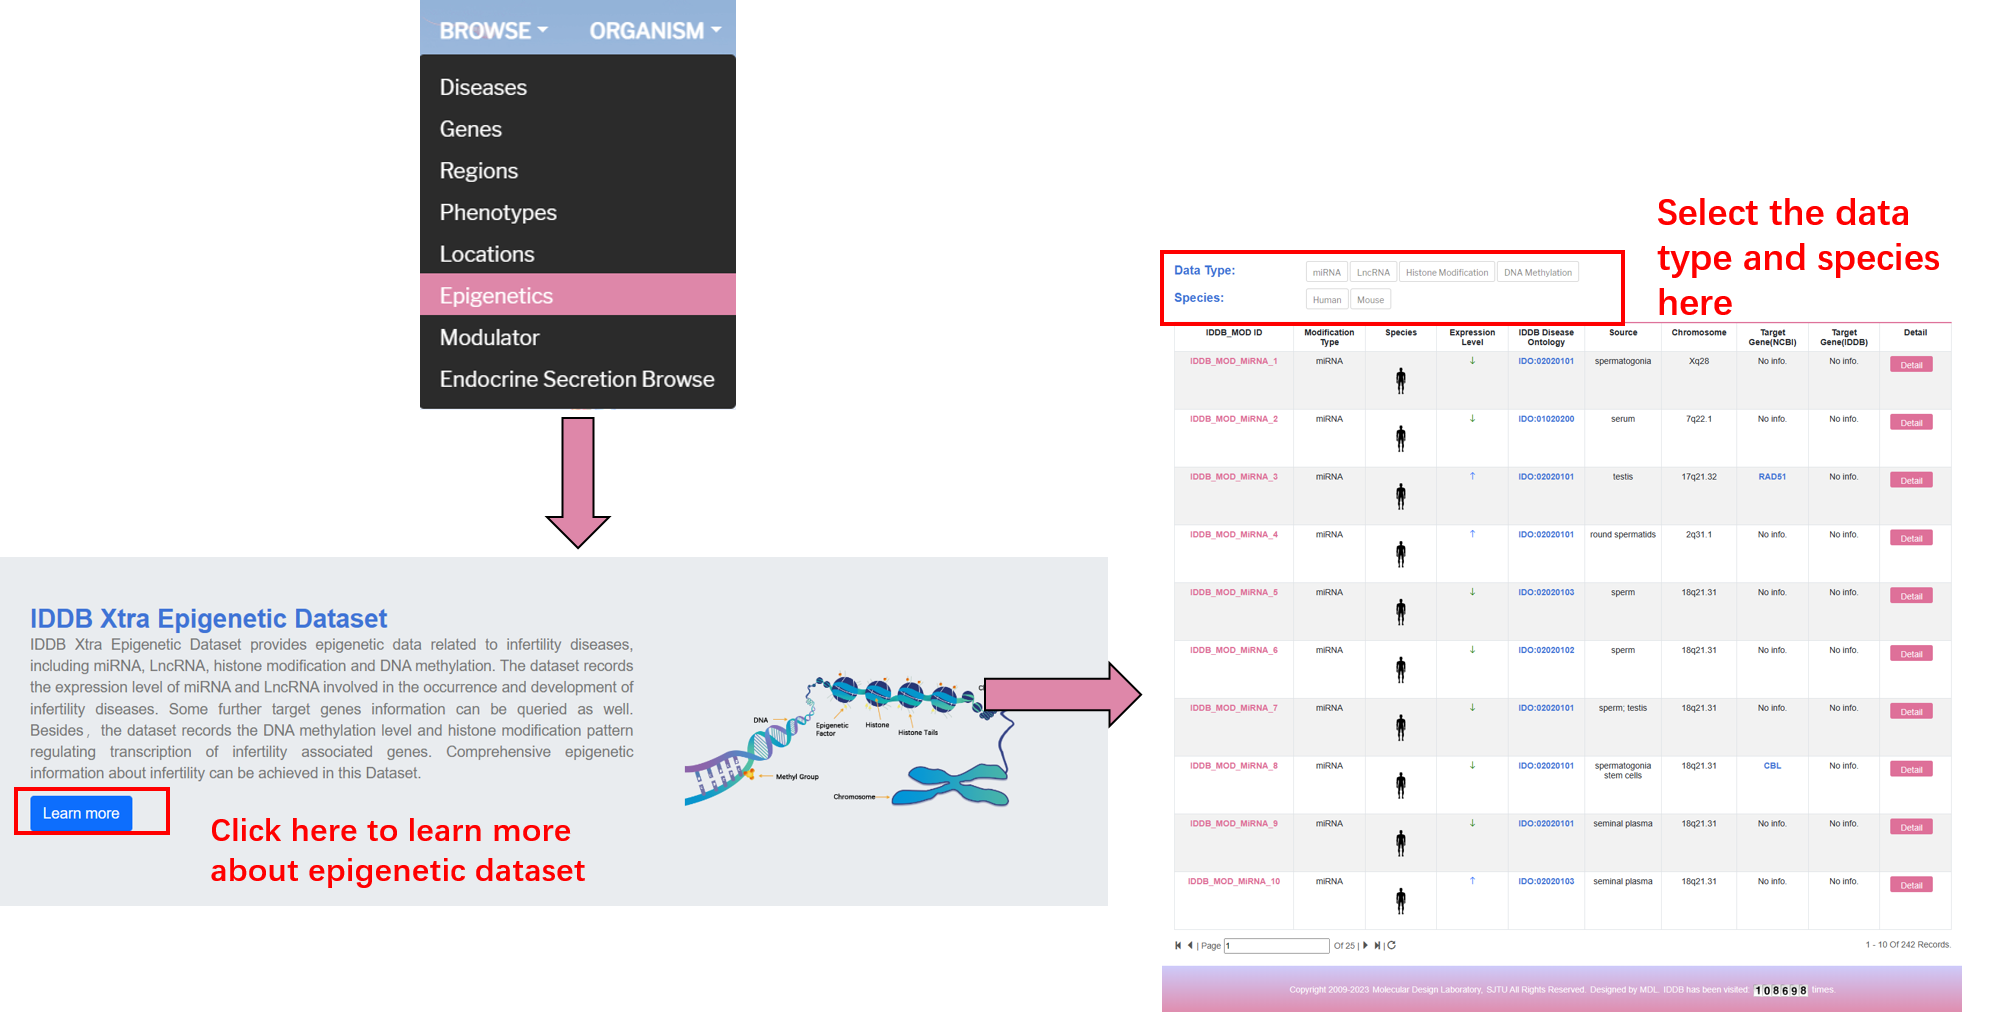
By clicking "Epigenetics" on the navigation bar, user can browse all epigenetic data.

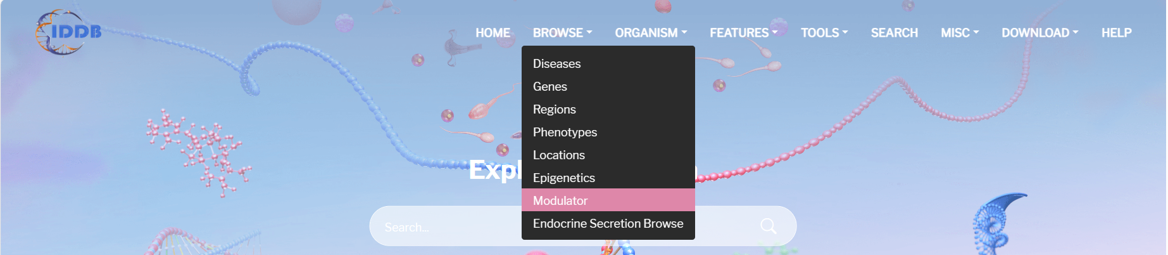
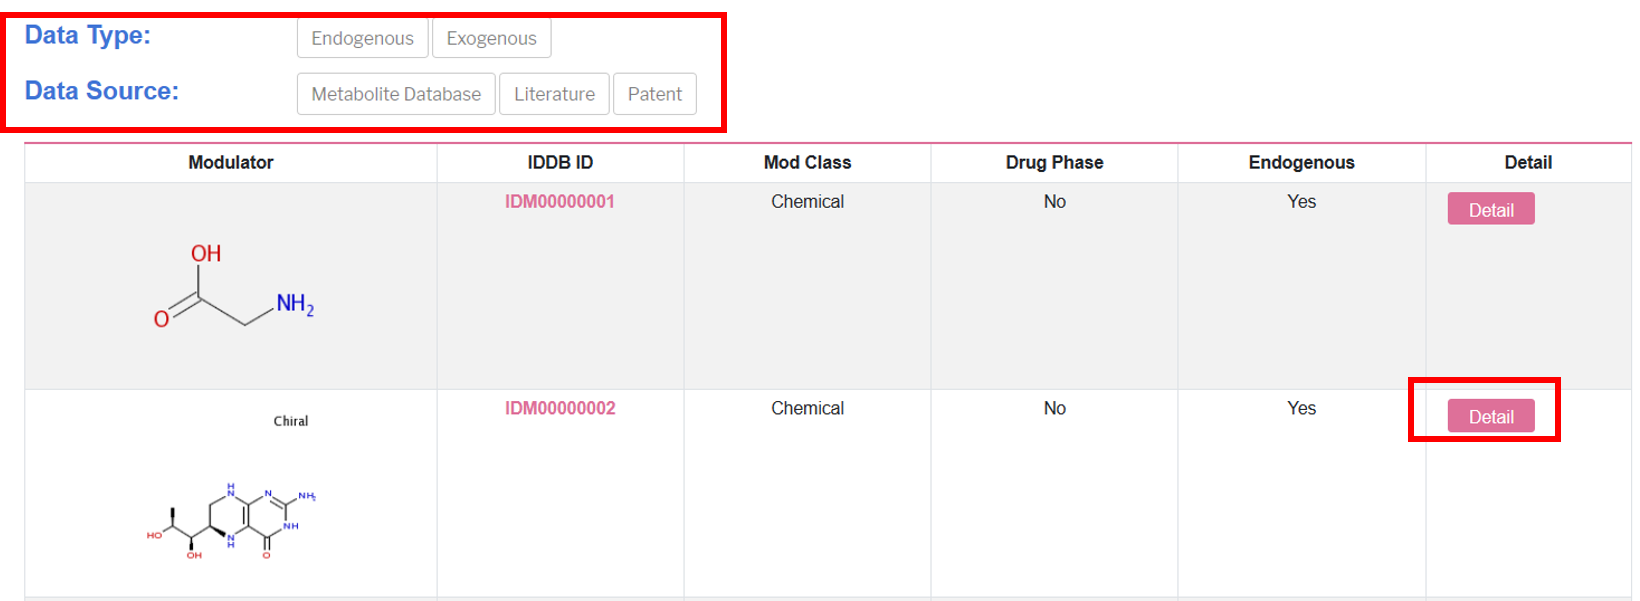
By clicking “Modulator” on the navigation bar, users can browse all related modulators in the database.
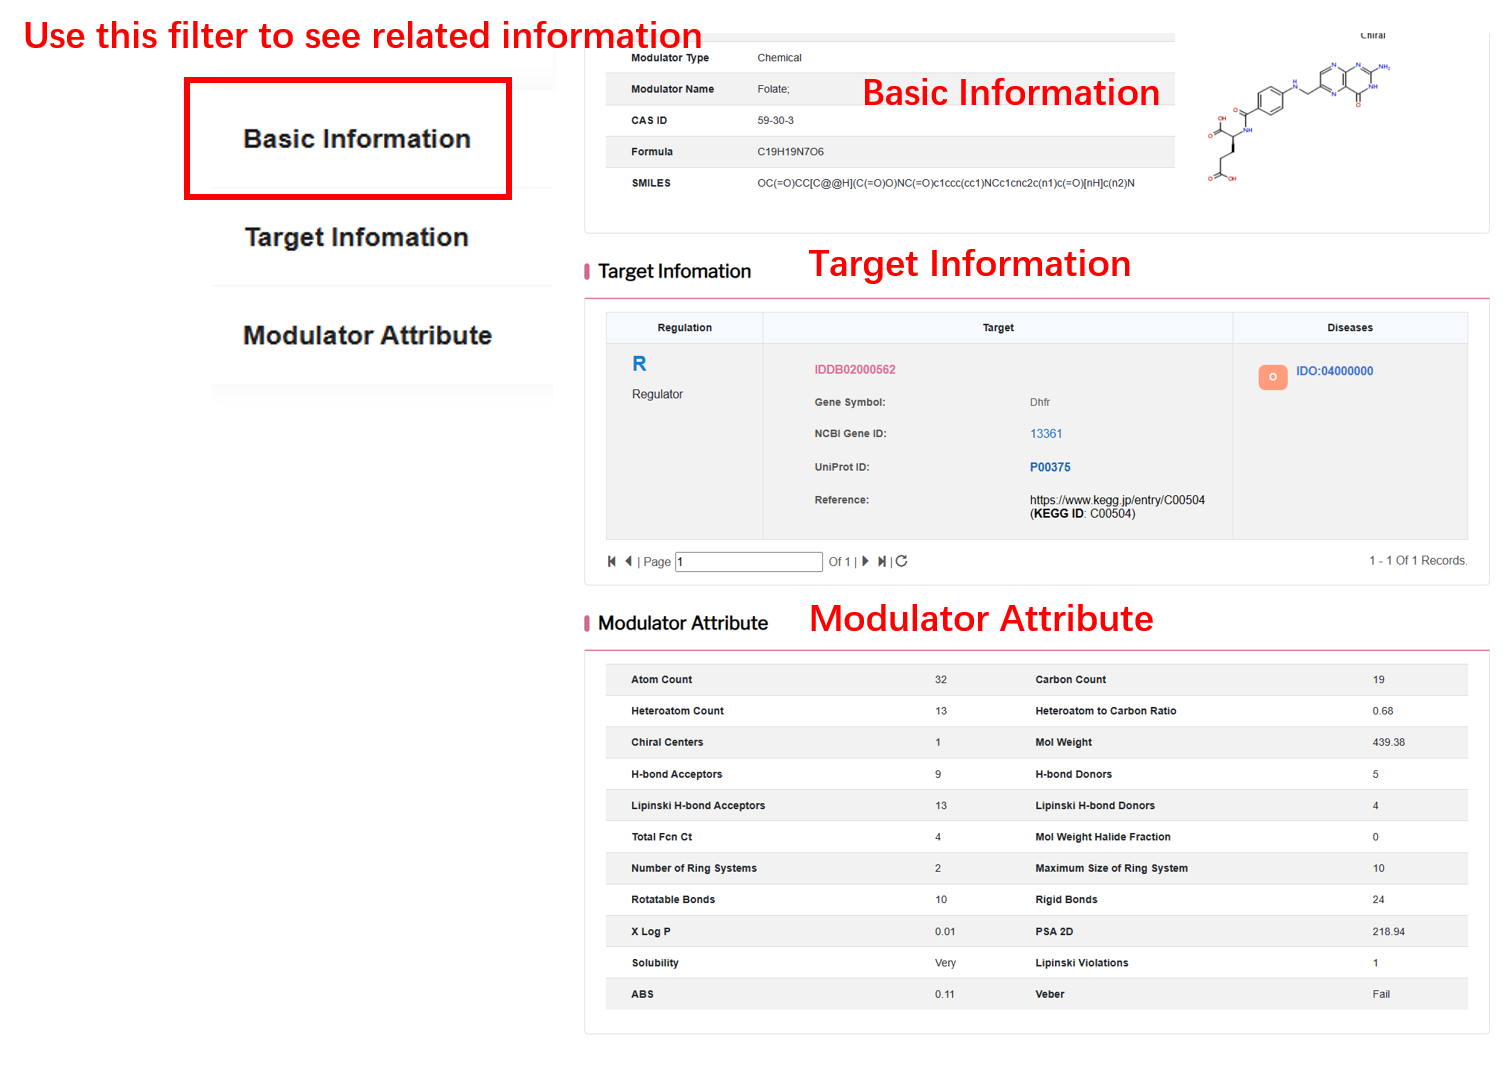
The introduction on the top briefly shows the main functions and datasets in this part, with a list of all related modulators in the database below, which shows molecular formula, IDDB ID, and more details of each modulator.
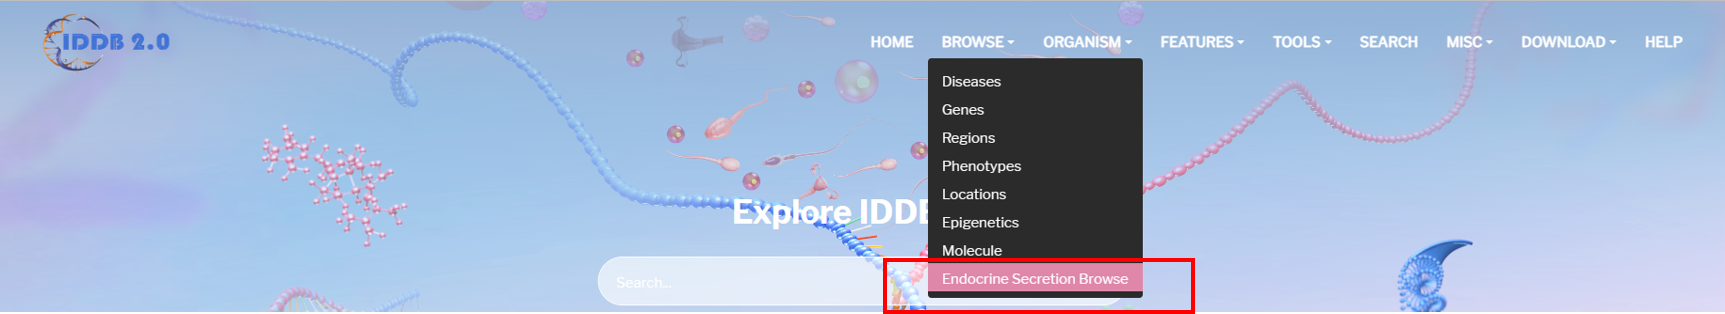
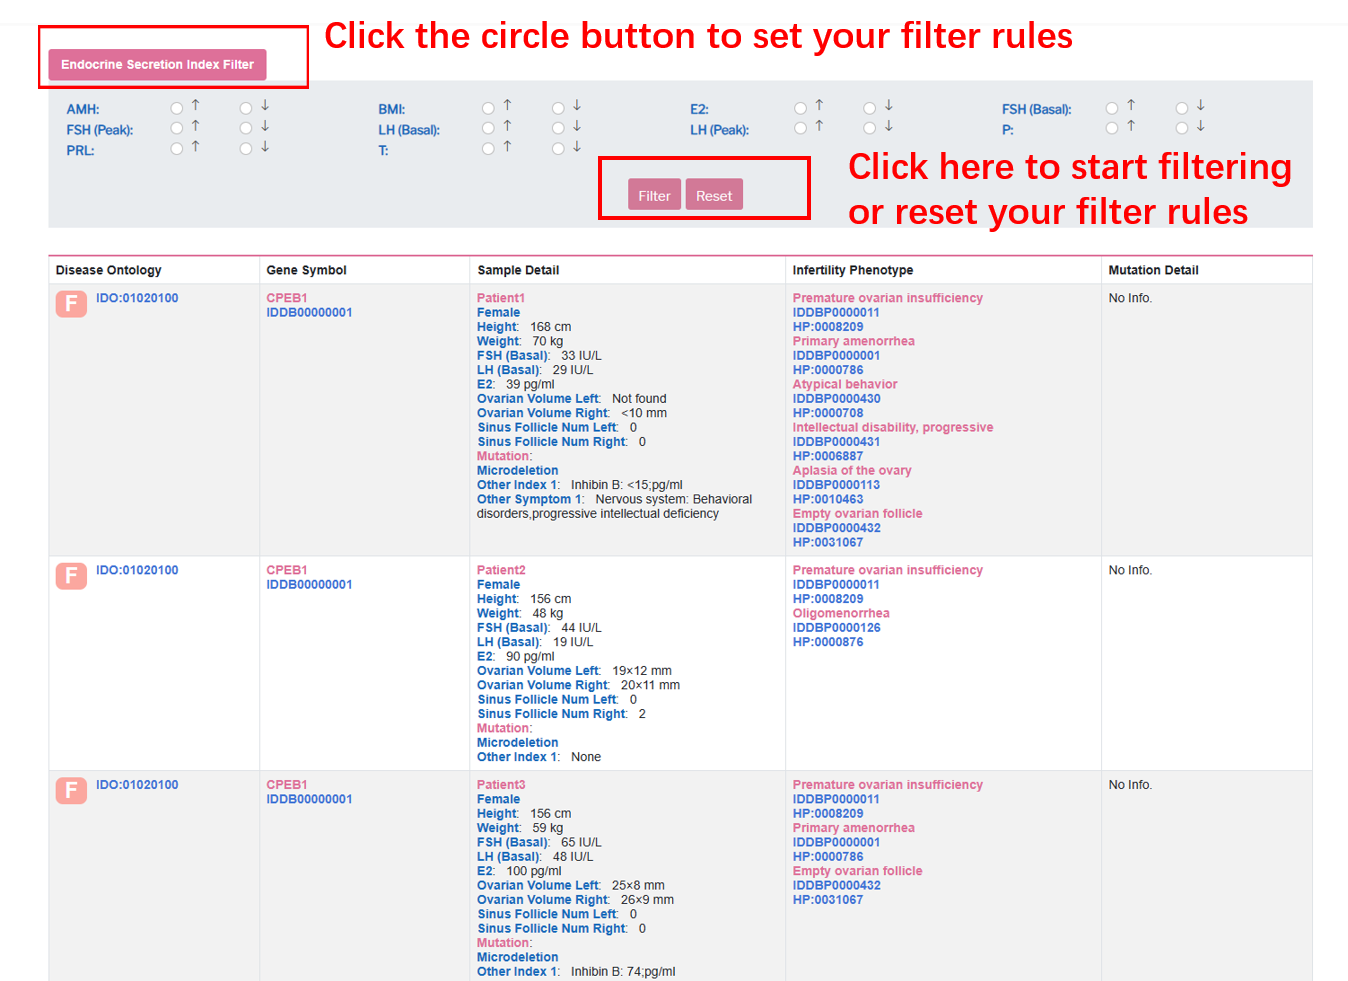
User can choose endocrine secretion index level and click“Filter” button to retrieve sample detail.
By clicking the organism of “ORGANISM” on the navigation bar, user can browse all genes of the selected organism in the database.
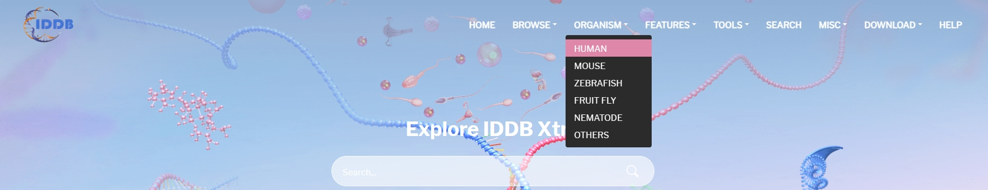
On the left of this page, there is the list of organisms and their corresponding gene counts in the database. On the right of this page, there is the list of genes of the selected organism.

By clicking “Detail” button, user can see the detail of each gene.
-
Mutation Landscape
By clicking “Mutation Landscape” on the navigation bar, user can browse the whole human mutation landscape based on all experimental validated mutations in the database.
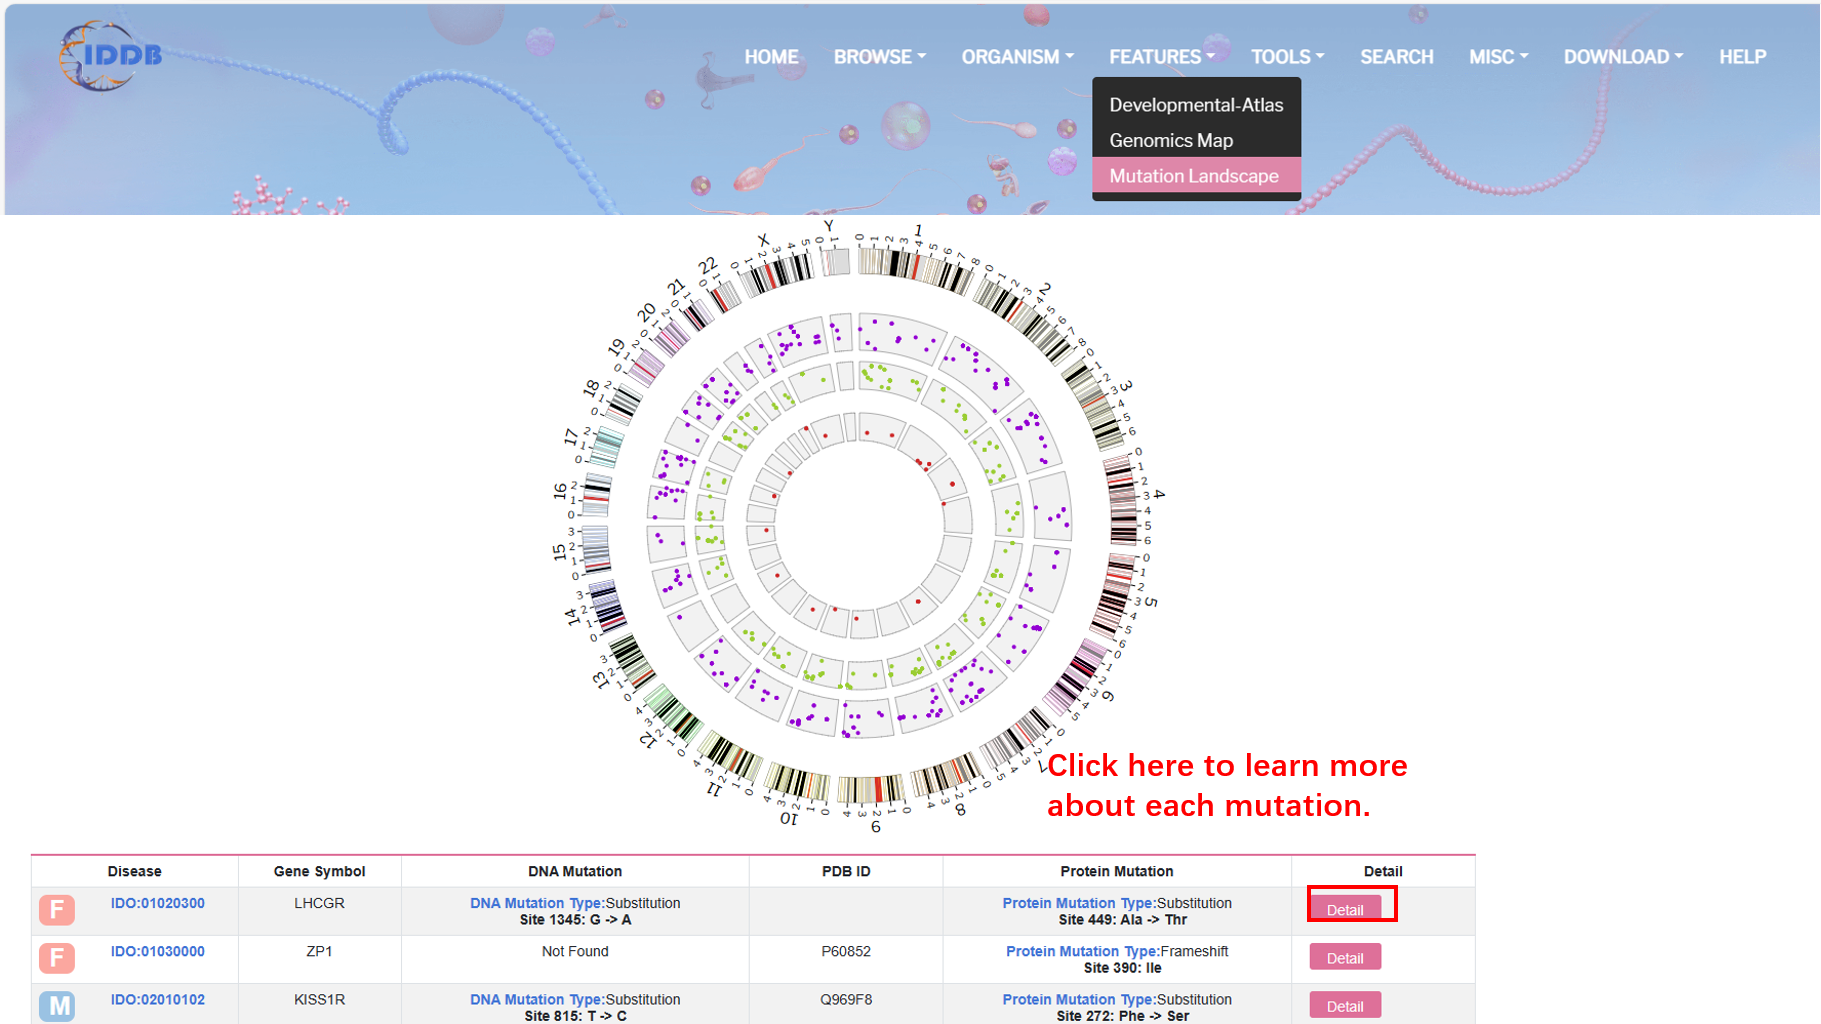
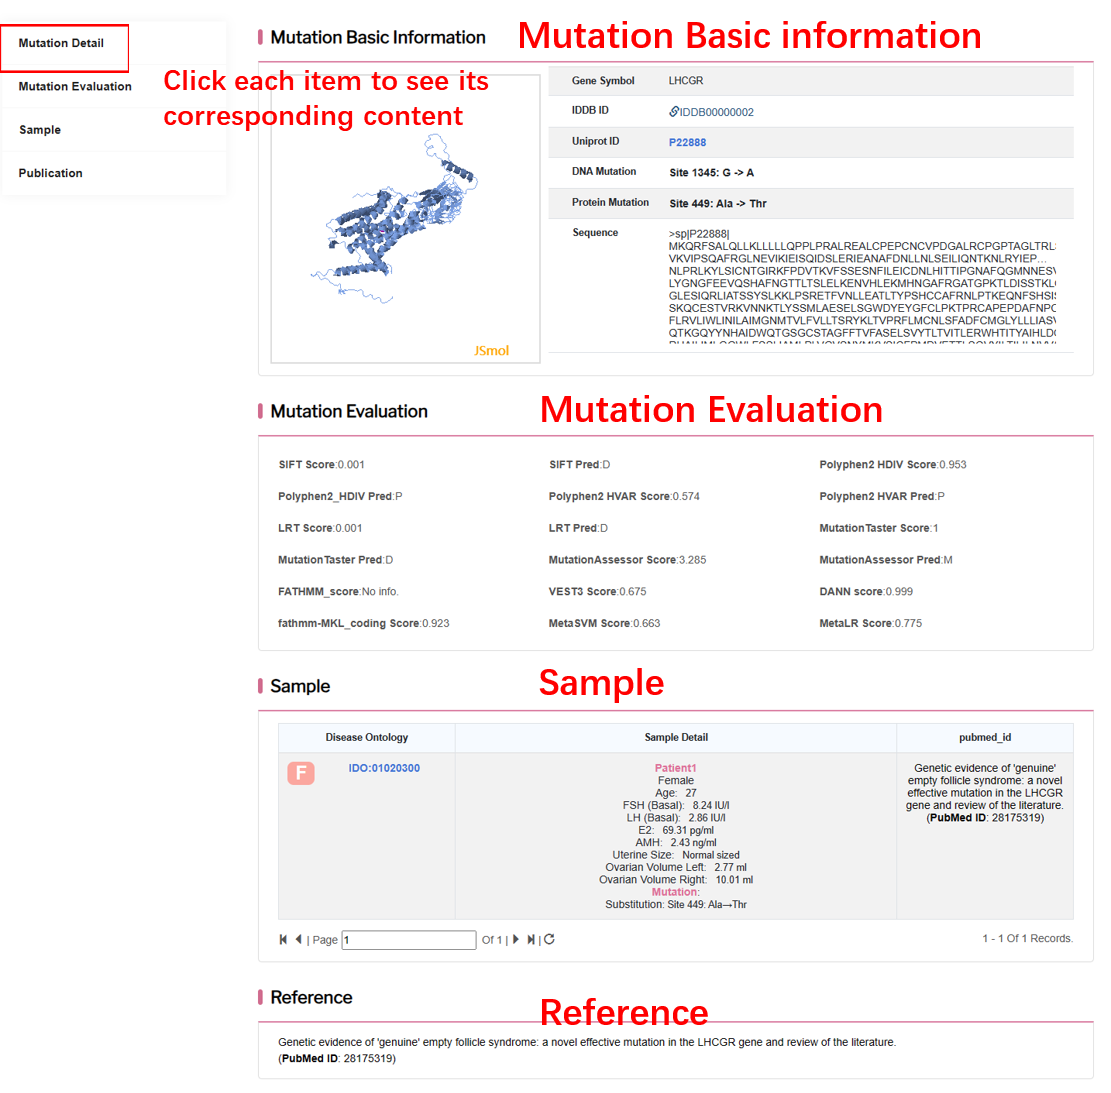
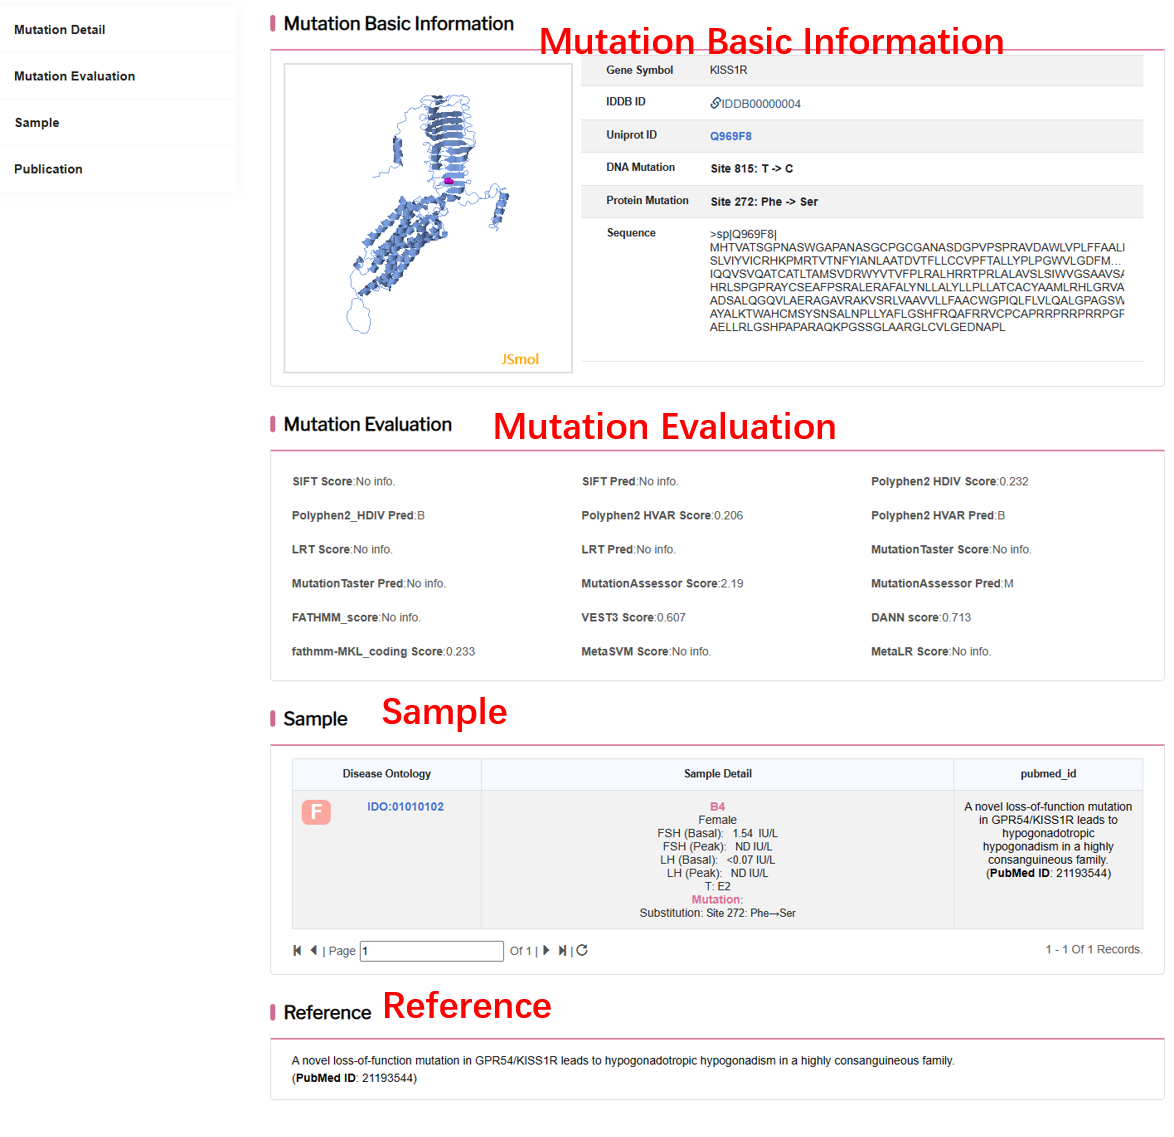
By clicking “Detail” button, user can see detailed information about each mutation.
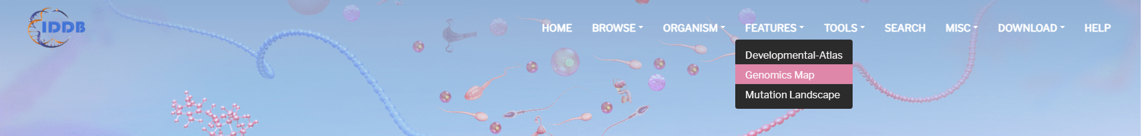
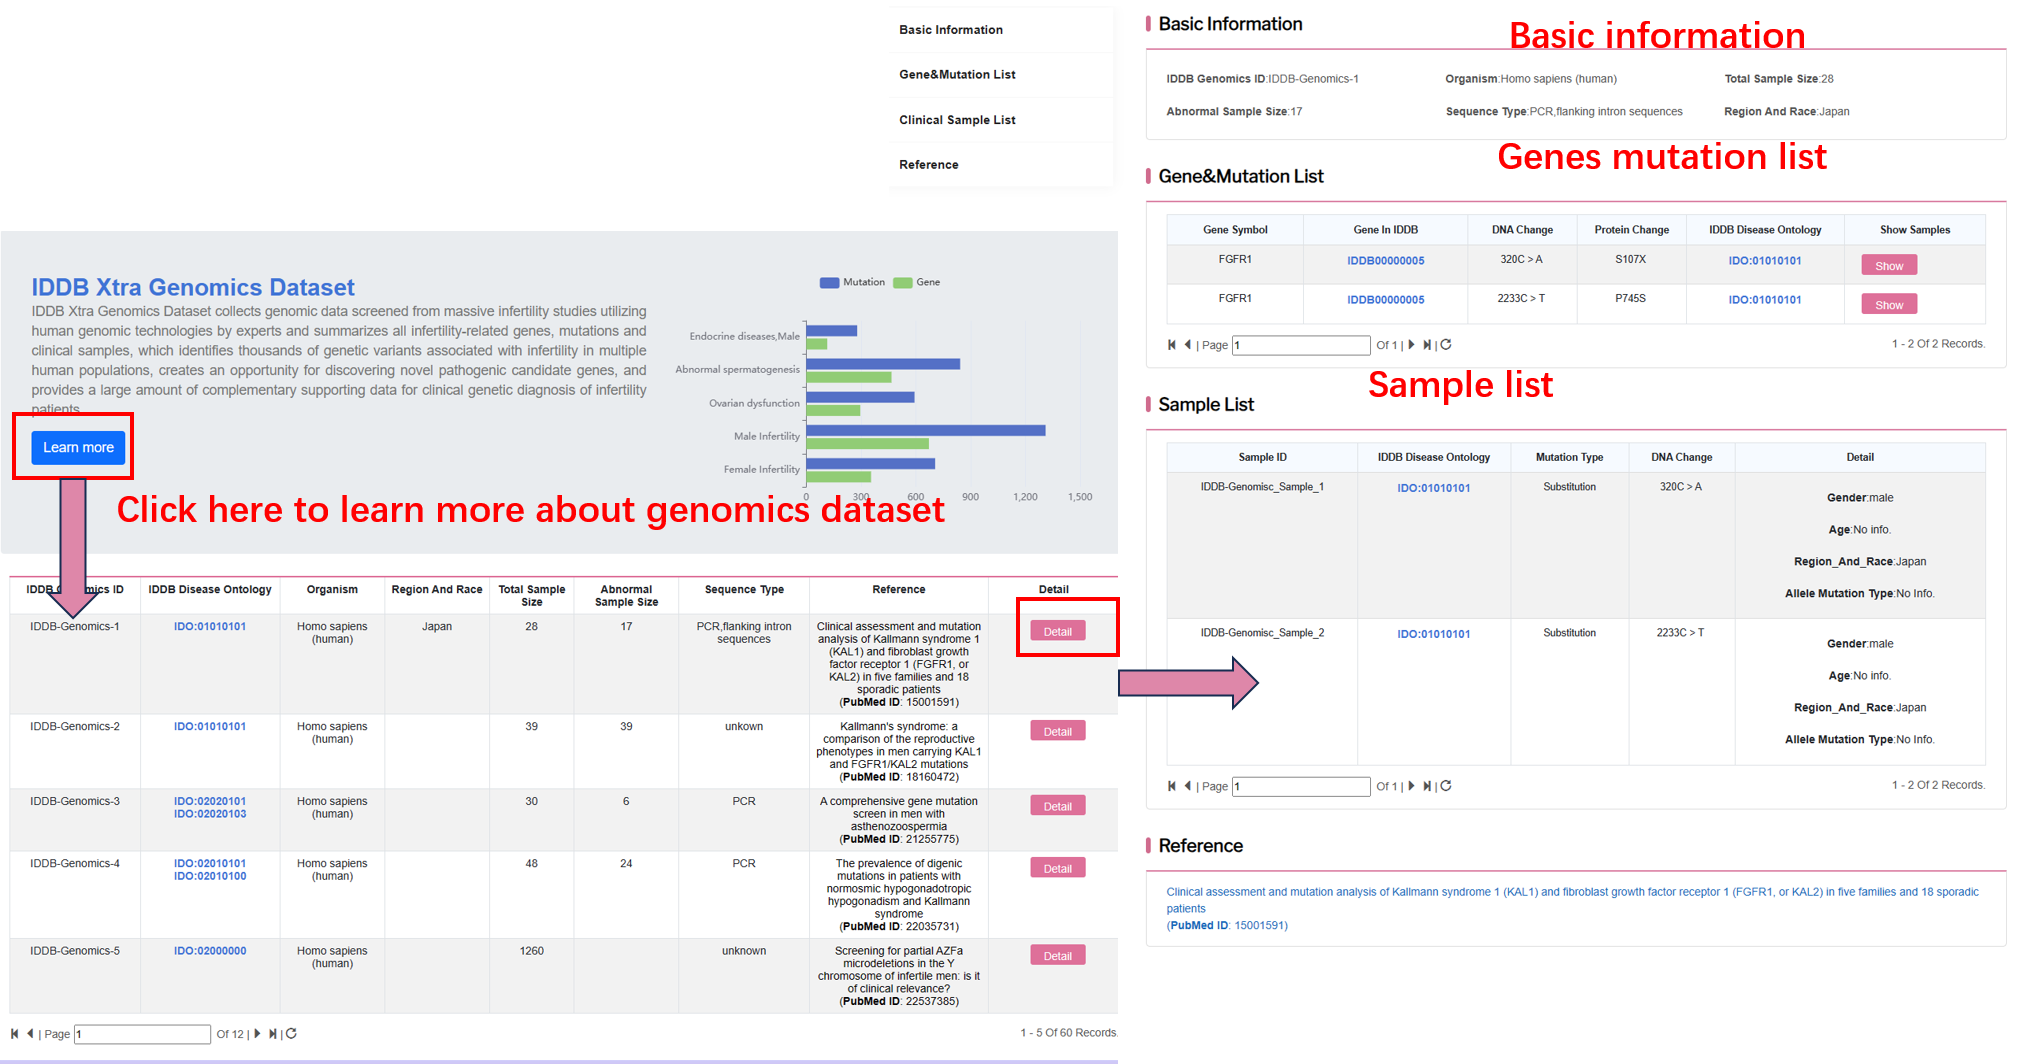
By clicking “genomics map” on the navigation bar, user can browse all genomics dataset.
By clicking “detail”, user can see the detail of each genomics data.
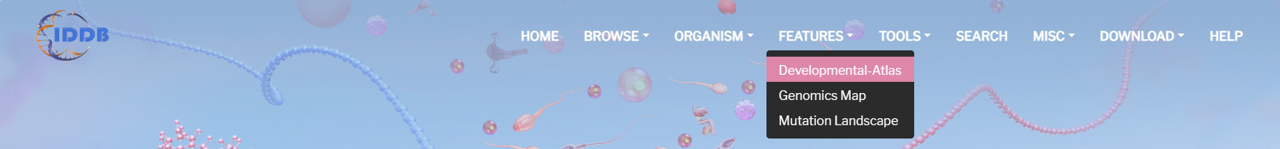
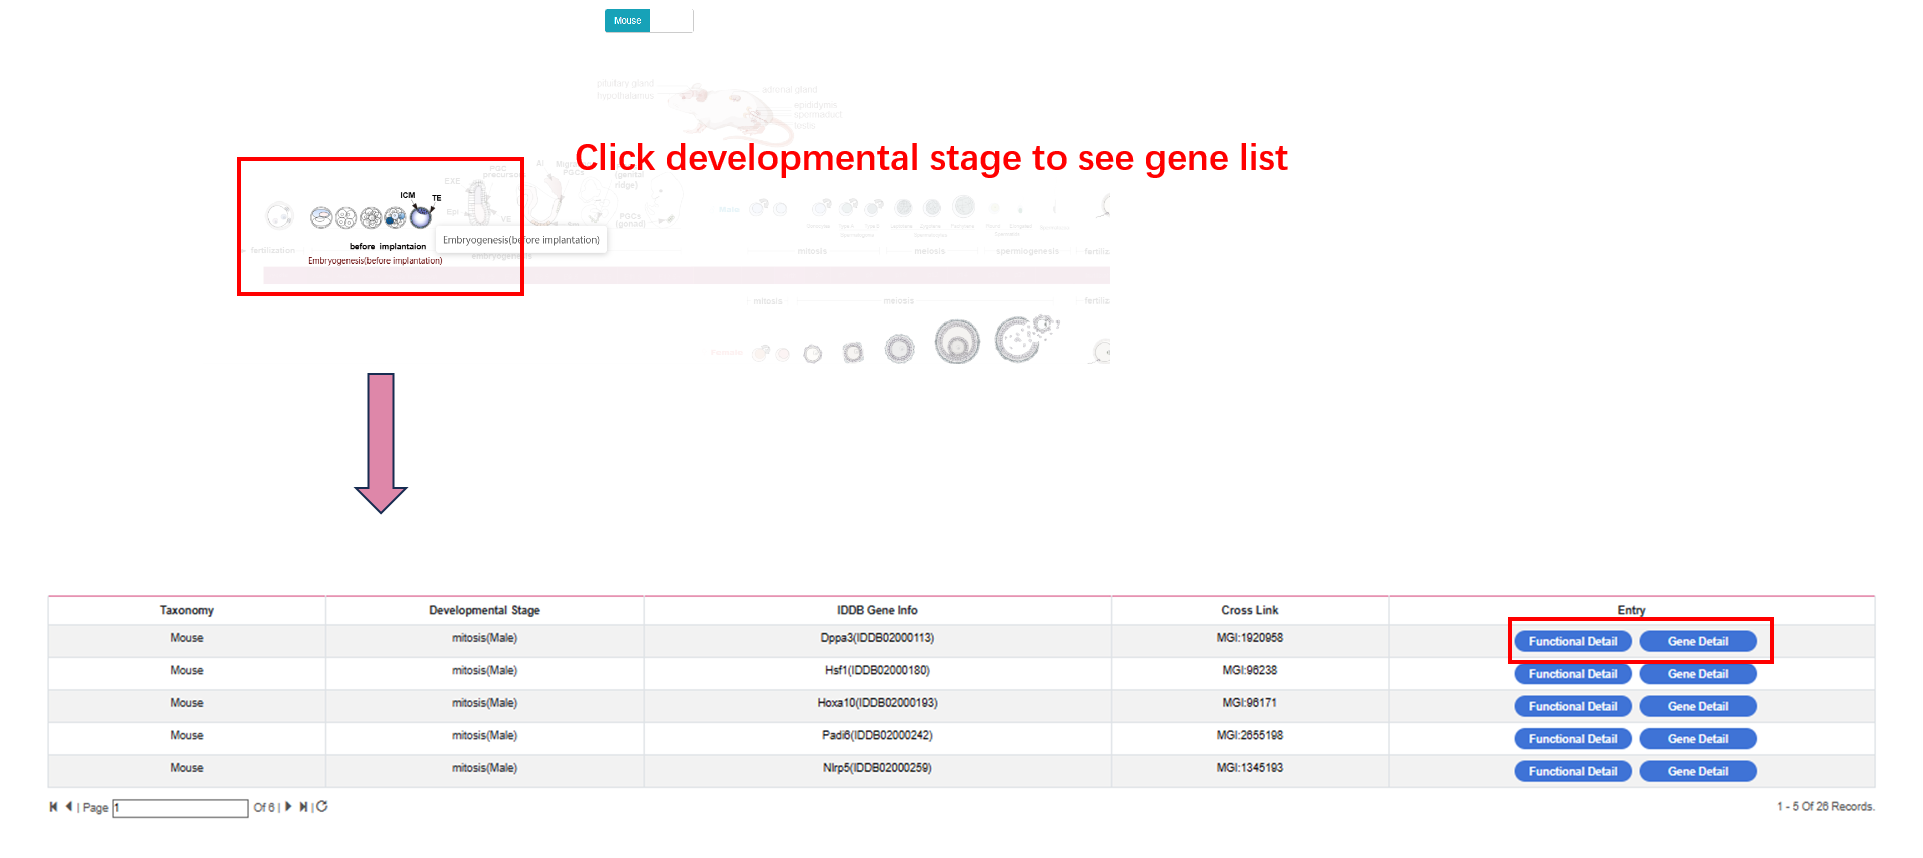
By clicking “development-atlas” on the navigation bar, user can browse human and mouse development atlas.
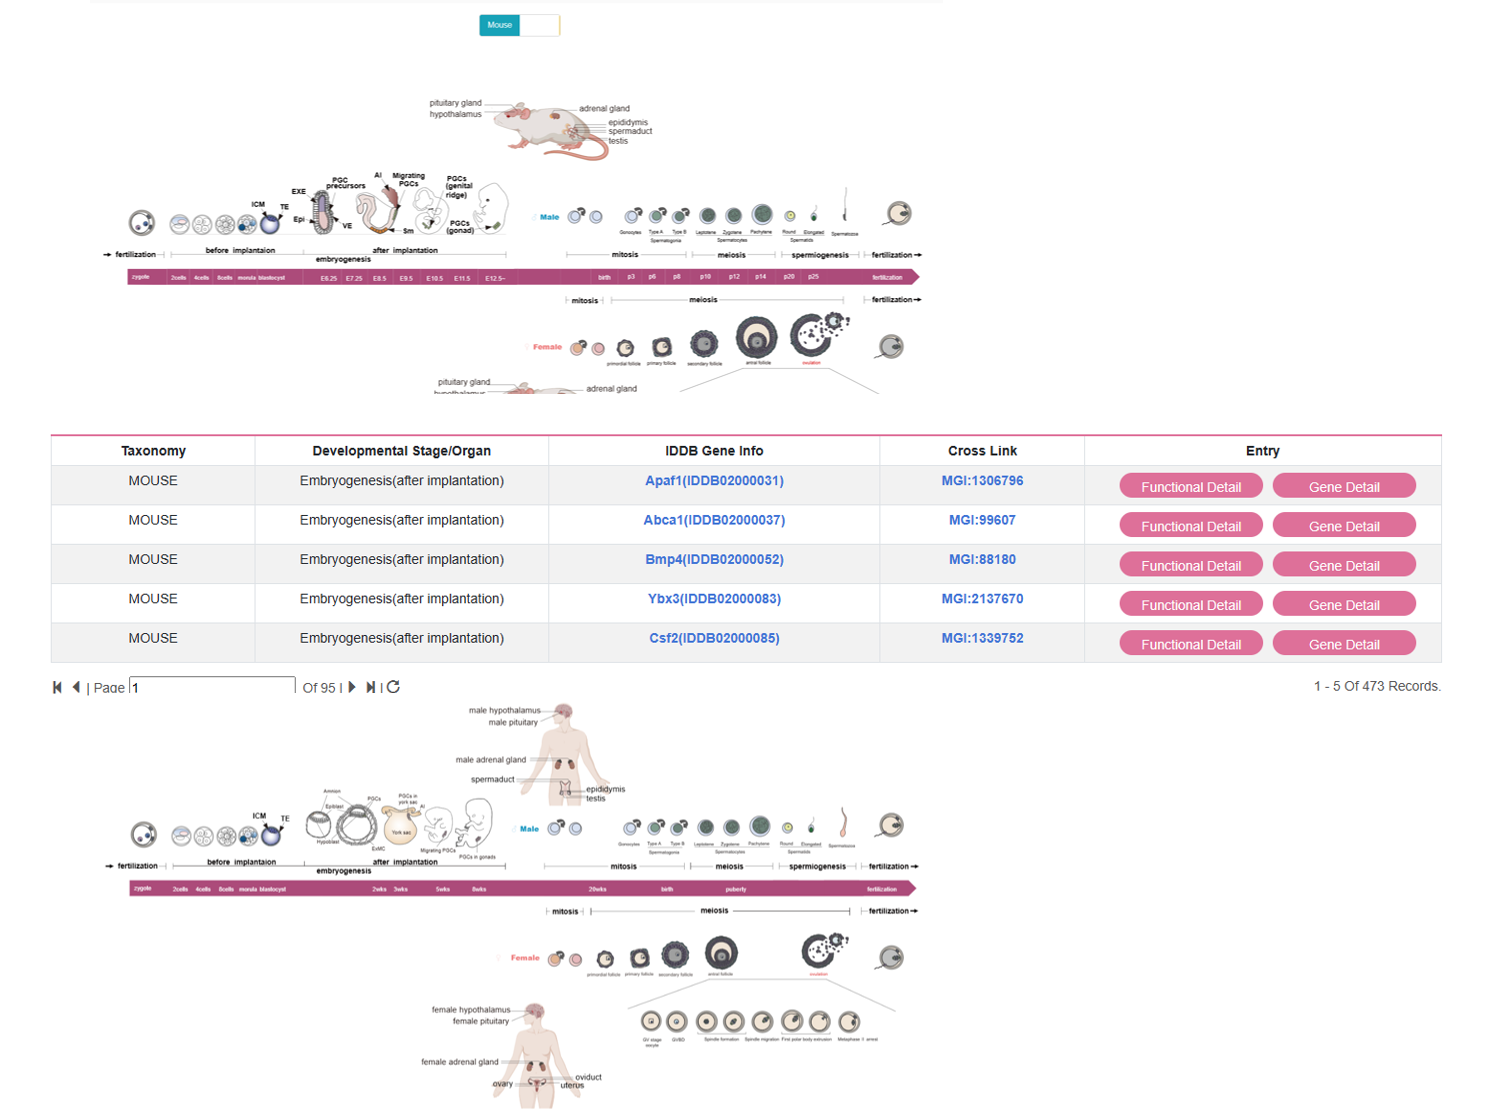
By clicking “functional detail”, user can see the functional detail of each gene. By clicking “gene detail”, user can see the gene detail information.

Mutation Matcher
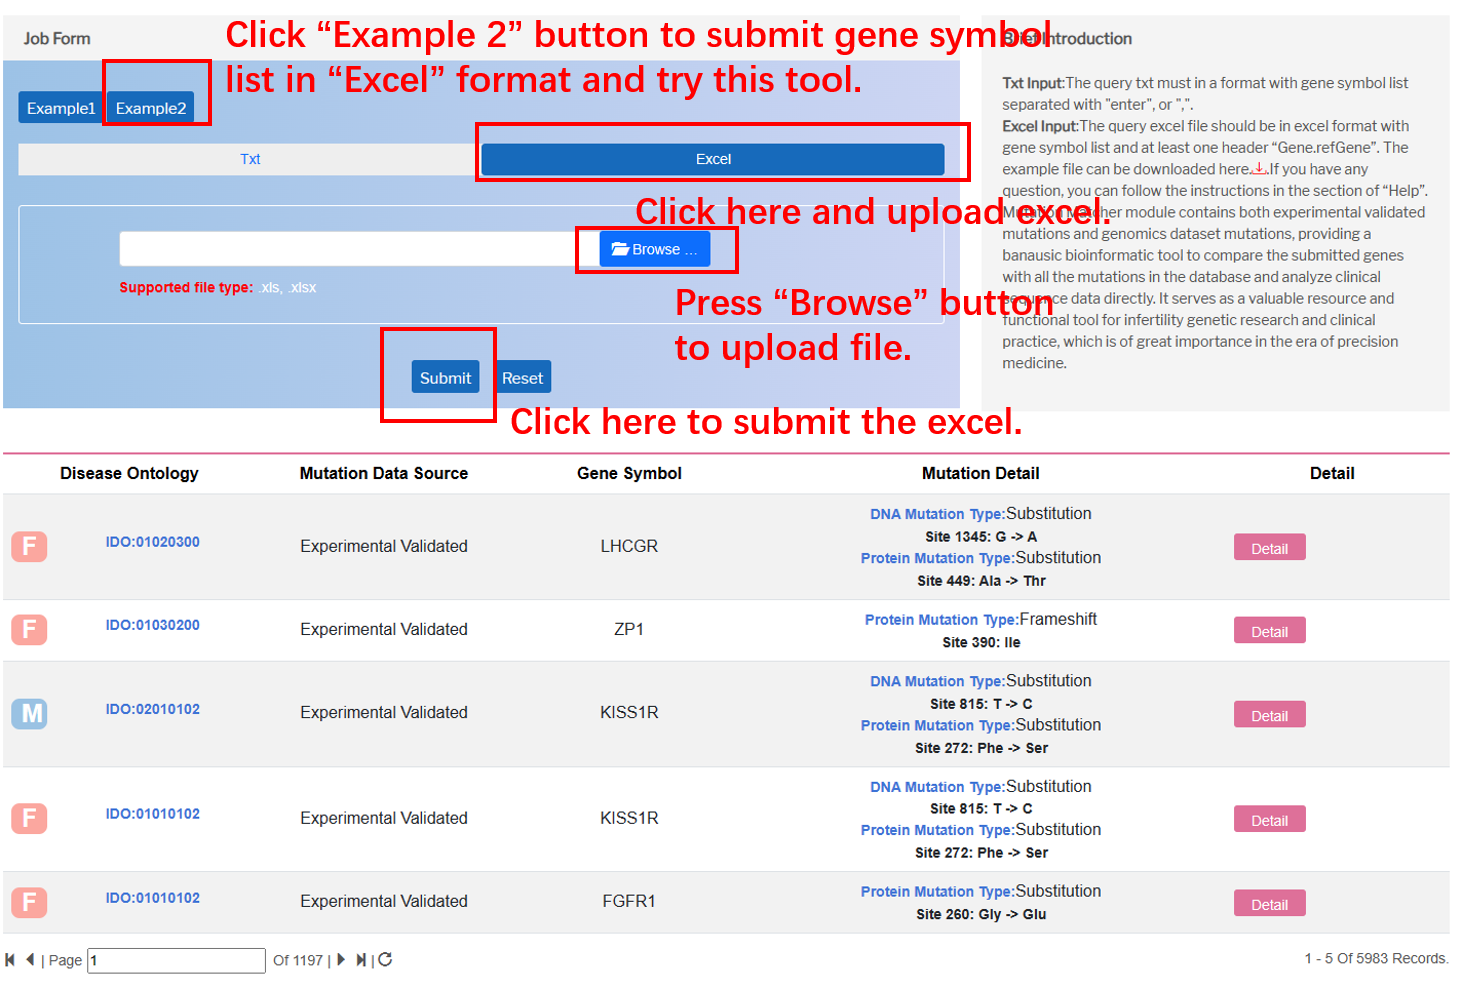
In the “Mutation Matcher” module on the navigation bar, user can utilize this bioinformatic tool to compare the submitted genes with all the mutations in the database via various file formats.

By clicking “Txt” button, the user can input gene symbol list separated with "enter", or ",".
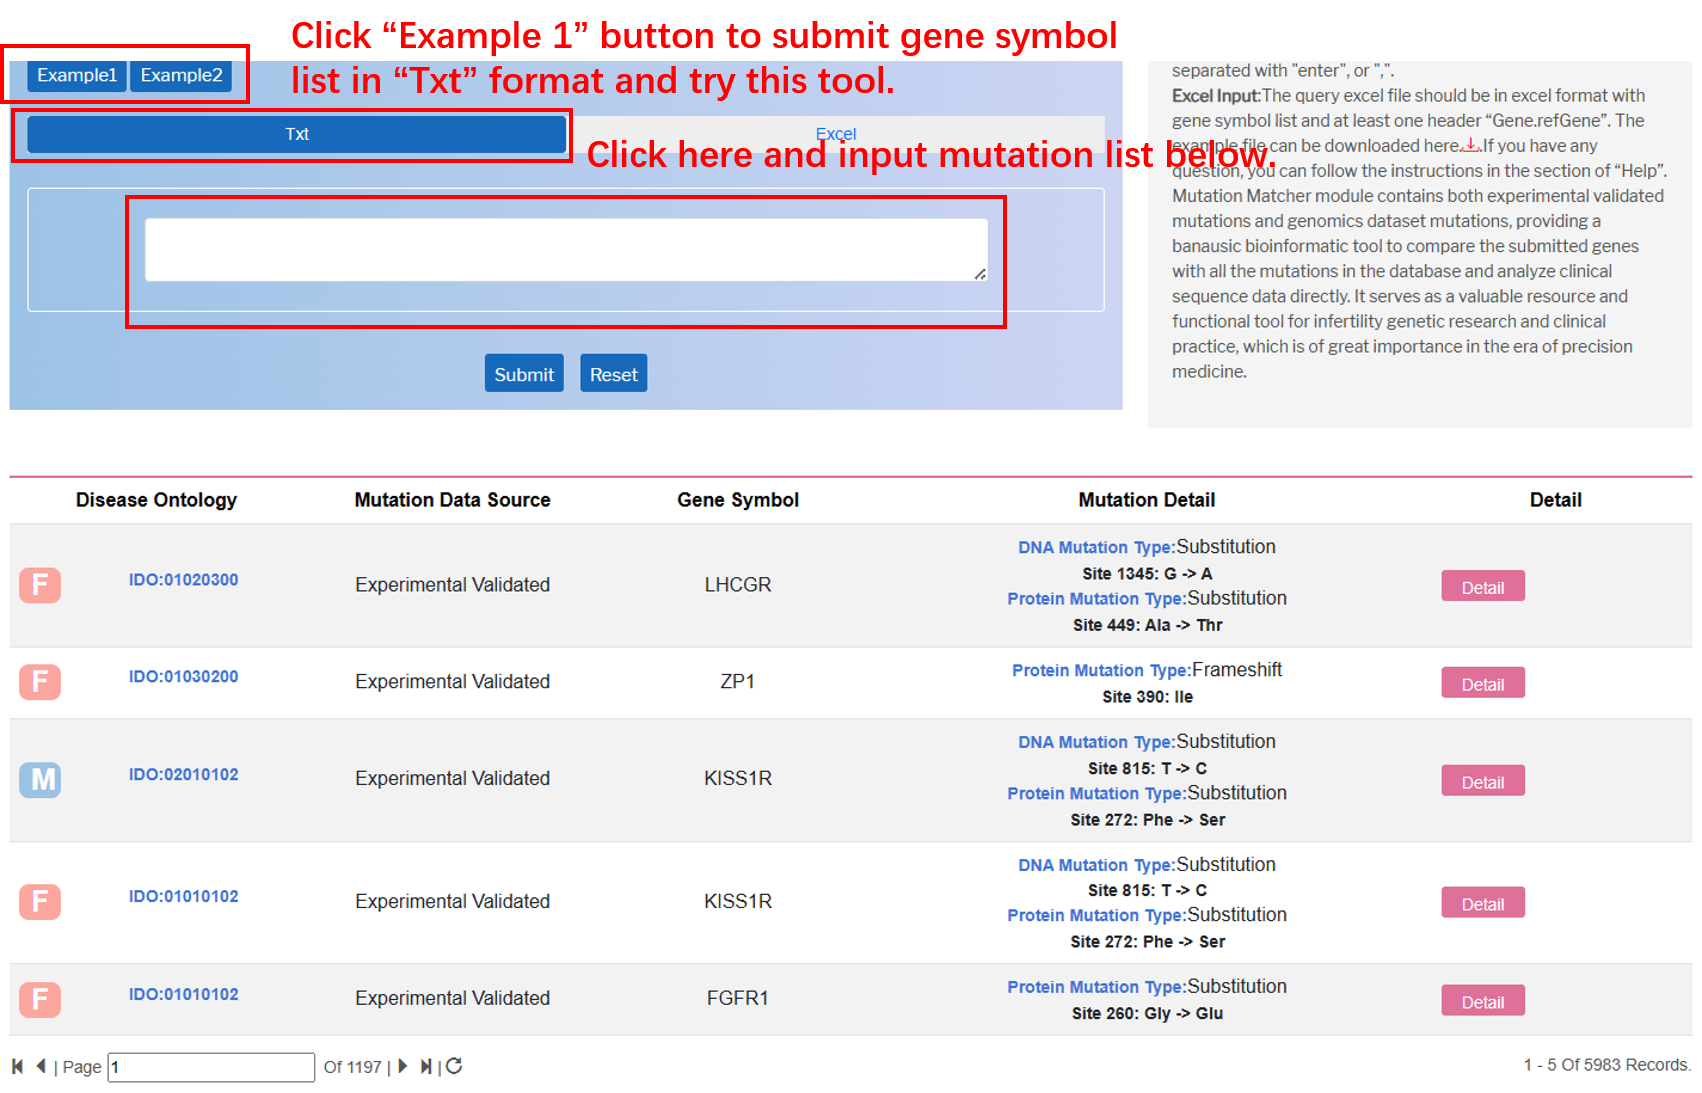
By clicking “Excel”, the user can submit the file of genes to fetch mutations in the whole database. Importantly, “Gene.refGene” should be added in the top of the excel as the example below.


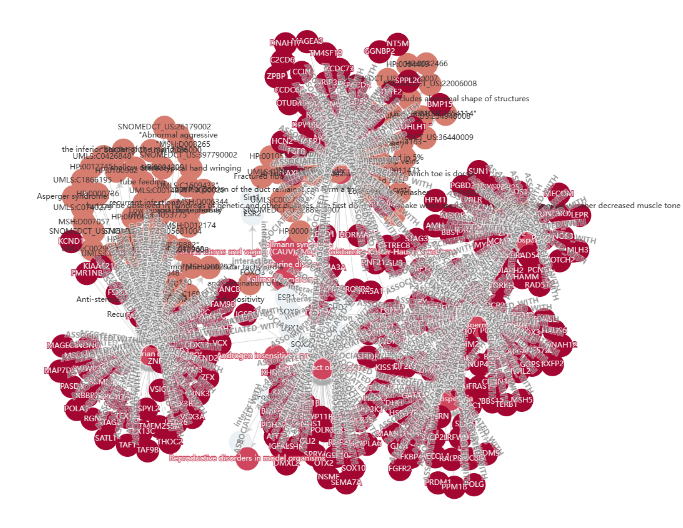
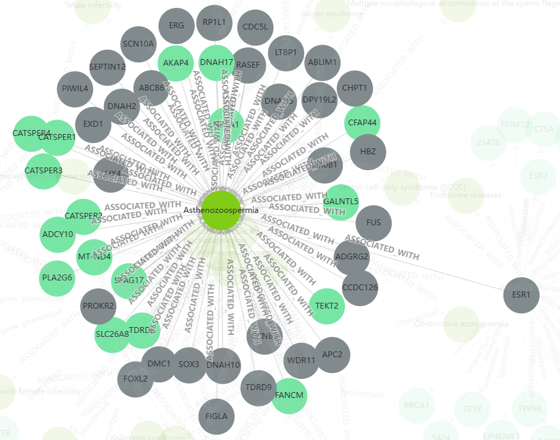
In the “Infertility Knowledge Graph” button on the navigation bar, user can browse gene-gene, gene-disease, gene-phenotype and disease-phenotype associations via heterogeneous networks.
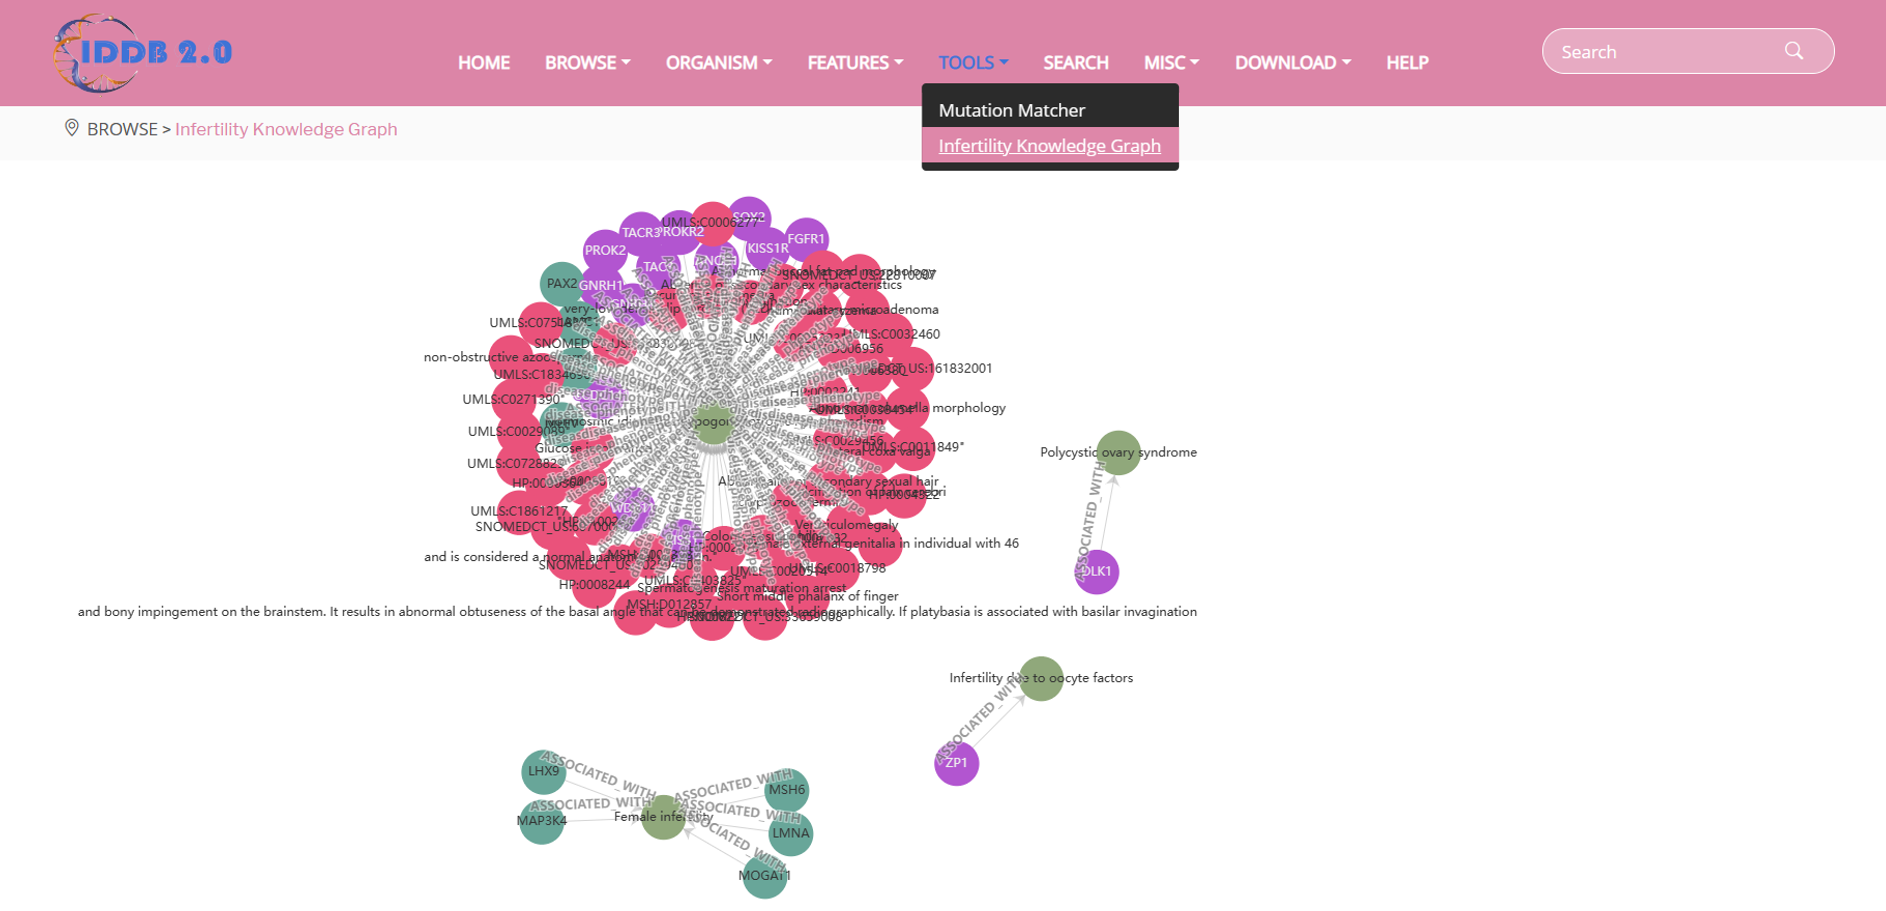
By clicking each gene, disease or phenotype name, user can see interdependencies between the selected element and other genes, diseases and phenotypes.
-
Quick Search
The search tool is on the right of the Top Menu. It allows users to search the whole database by entering a keyword. The matched results are returned in a grid, in which the search key strings are highlighted.
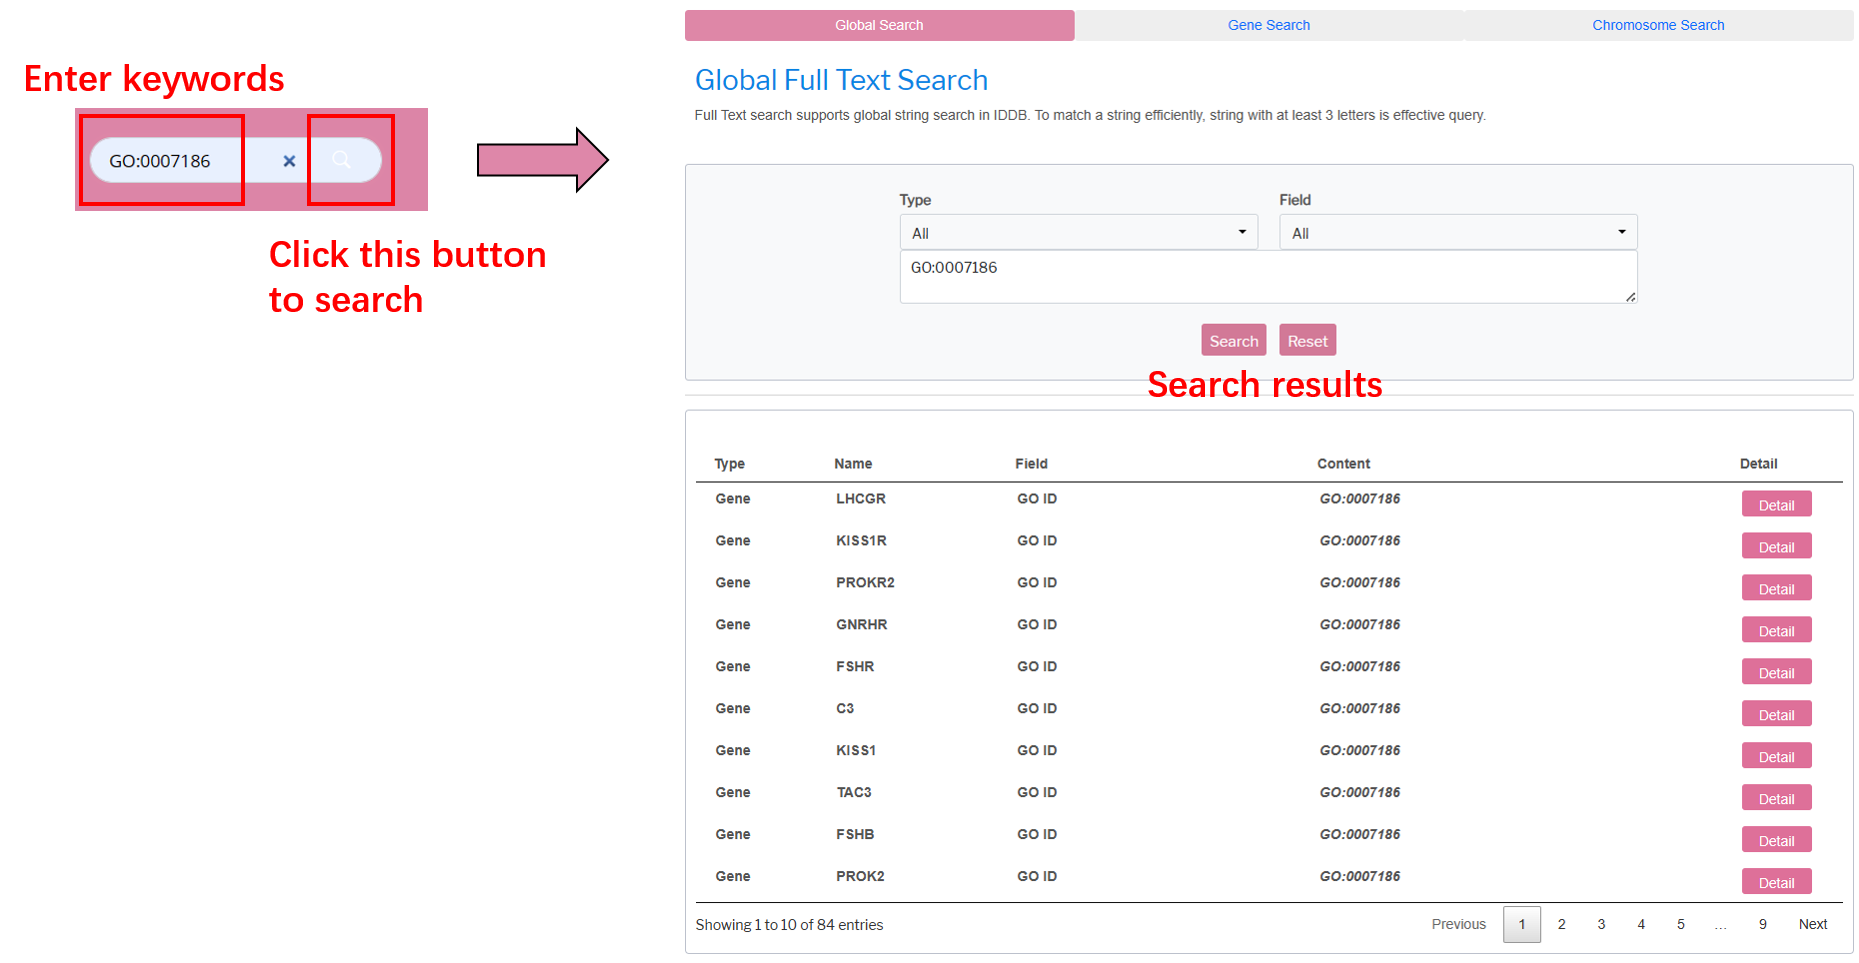
Global Search
Global Search supports global full text search in the database. Go to Global Search by clicking the Global Search tab button. String with at least three letters can be submitted as a search query. The matched results are returned in a grid and the search key string are highlighted just like the Quick Search.

Gene Symbol Search
Go to Gene Search by clicking the Gene Search tab button. User can get the search result by input a list of gene symbol list (eg. CPEB1 LHCGR ZP1) which are seperated by blanks.
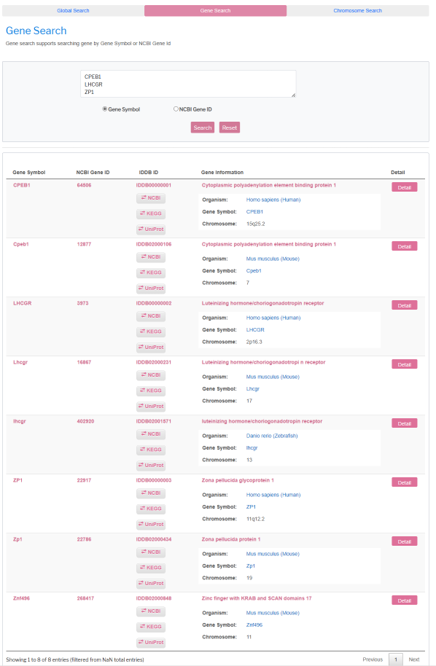
Gene Id Search
User can also get the search result by input a list of NCBI gene Id (eg. 64506 3973 22917) which are separated by blanks.

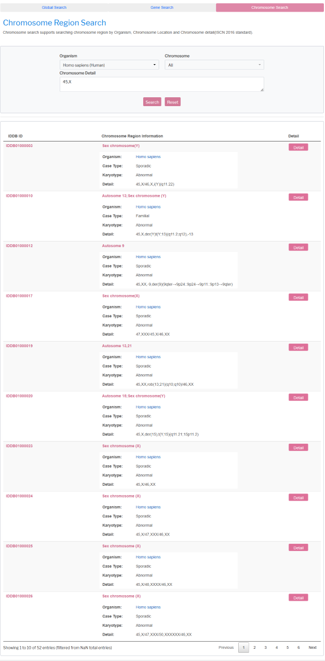
Chromosome Region Search
Chromosome Region Search supports searching region related diseases by selecting organism、chromosome and chromosome detail. The matched results are returned in a grid.